
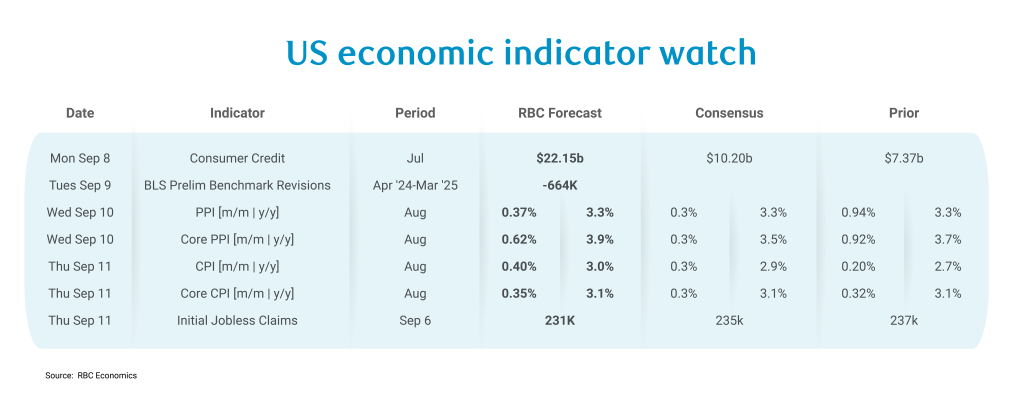
After a week focused on the deterioration in the labor market – which we think is bad but not ugly (see our comments here) – this coming week turns to the other side of the Fed’s mandate and where the more uncomfortable story lies. At the center, August CPI data is expected to show that inflation data is heating up further. We are continuing to grapple with upward pressure from both services and now core goods – as we expect tariff pressures to begin to materialize in the August data. With this in mind, we have core inflation still sitting at 3.1% y/y. Headline inflation is likely to rise to 3.0% – as upward pressure from food PPI in July is expected to show up in the CPI data this month. Pair this with upward pressure from gasoline on a seasonally adjusted basis, and we are likely to land at our Q4 headline target early. This poses upside risk to our headline inflation forecast for Q4, if we are correct and PPI pressures from food drive headline notably higher.
In the coming months, we continue to expect to see a sizeable share of tariff impacts show up in the fall inflation data. We have core inflation ticking up to 3.4% by year-end, assuming a gentle moderation but still heat underneath services inflation that is amplified.
We will be watching the inflation data through two core lenses:
1) Even ahead of tariff passthrough, we were going to be hard-pressed to see inflation reach target this year, since our view of higher inflation is only partly fueled by our assumptions around the impact of tariffs.
Services sector inflation continues to run hot, and this will prove problematic as tariff pressures show up in the CPI data and goods-pressures are compounded by pre-existing pressures in services. Shelter’s contribution to inflation will mount in the coming months, as owners’ equivalent of rent of primary residences (OER) is expected to move higher. Typically, OER lags upward movement in price data from National Association of Realtors by about 22-months, which suggests prices trending higher in the fall. Moreover, while we previously benefited from core goods deflation, those base effects have worn off.
2) Tariffs will soon start to build on services pressures, and we will likely start to see some of the tariff impact show up in core goods this month. Our forecast assumes pressures mounting in trade-exposed sectors including household furnishings and supplies, motor vehicle parts and equipment, and recreation commodities. We saw this in the PPI date last month, and we expect that this month’s core PPI print will point to pressures in trade-exposed transportation and warehousing and trade services as producers preemptively pass off higher prices to wholesalers and retailers and margins widen temporarily. We expect to see another hefty +0.62% m/m core PPI print, nudging the year-over-year price index to 3.9%.
While all eyes will be on CPI, we’ll also be keeping tabs on the BLS Benchmark Revisions on Tuesday. It’s worth taking a moment to dissect what is going on with these annual revisions – what they mean and what they don’t.
We are expecting sizeable downward revisions (in the range of -500k to -900k) to the payroll data from April 2024 to March 2025, as the Quarterly Census of Employment and Wages (QCEW) job data is tracking roughly 20% below monthly payroll gains from April to December 2024. If we assume this difference holds from January to March, we likely added 540k fewer jobs to the US economy over the April ’24 to March ’25 period than the current payroll data suggests. Towards the end of 2024, however, the relationship between QCEW and the Current Employment Survey (upon which monthly payroll data is based) has broken down even further. In December, QCEW estimates were >40% below payroll numbers. In a worst-case scenario, we could see downward revisions as high as ~885k. We think the most likely case is a more conservative estimate of ~664k fewer jobs added, which averages 55k fewer jobs created each month.
These revisions present an important caveat for breakeven payroll employment. We had previously assumed a ~100K breakeven rate for payroll employment, meaning that if we see fewer than 100K jobs added to the US economy in a given month, this would nudge the unemployment rate higher (as we saw in August). But if we assume 540k fewer jobs were added to the US economy or even 664k fewer through Q1 this year, this suggests anywhere from 45 to 55k fewer jobs created each month which implies a breakeven rate that is half the size of what we previously assumed (50k vs. initially assumed 100k). This would be consequential for our interpretation of recent monthly NFP revisions – in essence, they would not be as severe as they seem. Still, even if breakeven employment is revised lower, we still likely experienced sub-breakeven payroll growth in three of the last four months. And still, most payroll gains in recent months have been in the non-cyclical health and social assistance sector and even with a 50k breakeven rate for NFP, we can still ascertain that we are seeing a cyclical erosion in the labor market. The dissonance between cyclical weakness and structural gains, if anything, is making it continuously more difficult to interpret monthly NFP prints and tells us that more emphasis should be given to the trajectory of the US unemployment rate.
Outside of inflation and benchmark revisions, there are a few other major data releases next week:
-
Initial Jobless Claims will likely come in just a touch lower for the week of September 6th at 231k after a slight upside this past week. Continued claims appear to have plateaued this week but are still on a concerning trajectory. The share of unemployed job seekers who are long-term unemployed reached its highest level in three years as of August and while the unemployment rate ticked up by one-tenth, the U6 Unemployment rate, which includes marginally attached persons and those working part time for economic reasons, ticked up by a more notable two-tenths. We continue to see new graduates and re-entrants dealt the biggest blow in a labor market that is frozen.
-
We expect the Consumer Credit data on Monday to show credit outstanding rose by $22.1b with the more pronounced uptick coming from nonrevolving consumer credit, as we have seen consistently in recent months.
About the Authors
Frances Donald is the Chief Economist at RBC and oversees a team of leading professionals, who deliver economic analyses and insights to inform RBC clients around the globe. Frances is a key expert on economic issues and is highly sought after by clients, government leaders, policy makers, and media in the U.S. and Canada.
Carrie Freestone is an economist and a member of the macroeconomic analysis group. She is responsible for examining key economic trends including consumer spending, labour markets, GDP, and inflation.
This article is intended as general information only and is not to be relied upon as constituting legal, financial or other professional advice. The reader is solely liable for any use of the information contained in this document and Royal Bank of Canada (“RBC”) nor any of its affiliates nor any of their respective directors, officers, employees or agents shall be held responsible for any direct or indirect damages arising from the use of this document by the reader. A professional advisor should be consulted regarding your specific situation. Information presented is believed to be factual and up-to-date but we do not guarantee its accuracy and it should not be regarded as a complete analysis of the subjects discussed. All expressions of opinion reflect the judgment of the authors as of the date of publication and are subject to change. No endorsement of any third parties or their advice, opinions, information, products or services is expressly given or implied by Royal Bank of Canada or any of its affiliates.
This document may contain forward-looking statements within the meaning of certain securities laws, which are subject to RBC’s caution regarding forward-looking statements. ESG (including climate) metrics, data and other information contained on this website are or may be based on assumptions, estimates and judgements. For cautionary statements relating to the information on this website, refer to the “Caution regarding forward-looking statements” and the “Important notice regarding this document” sections in our latest climate report or sustainability report, available at: https://www.rbc.com/our-impact/sustainability-reporting/index.html. Except as required by law, none of RBC nor any of its affiliates undertake to update any information in this document.