

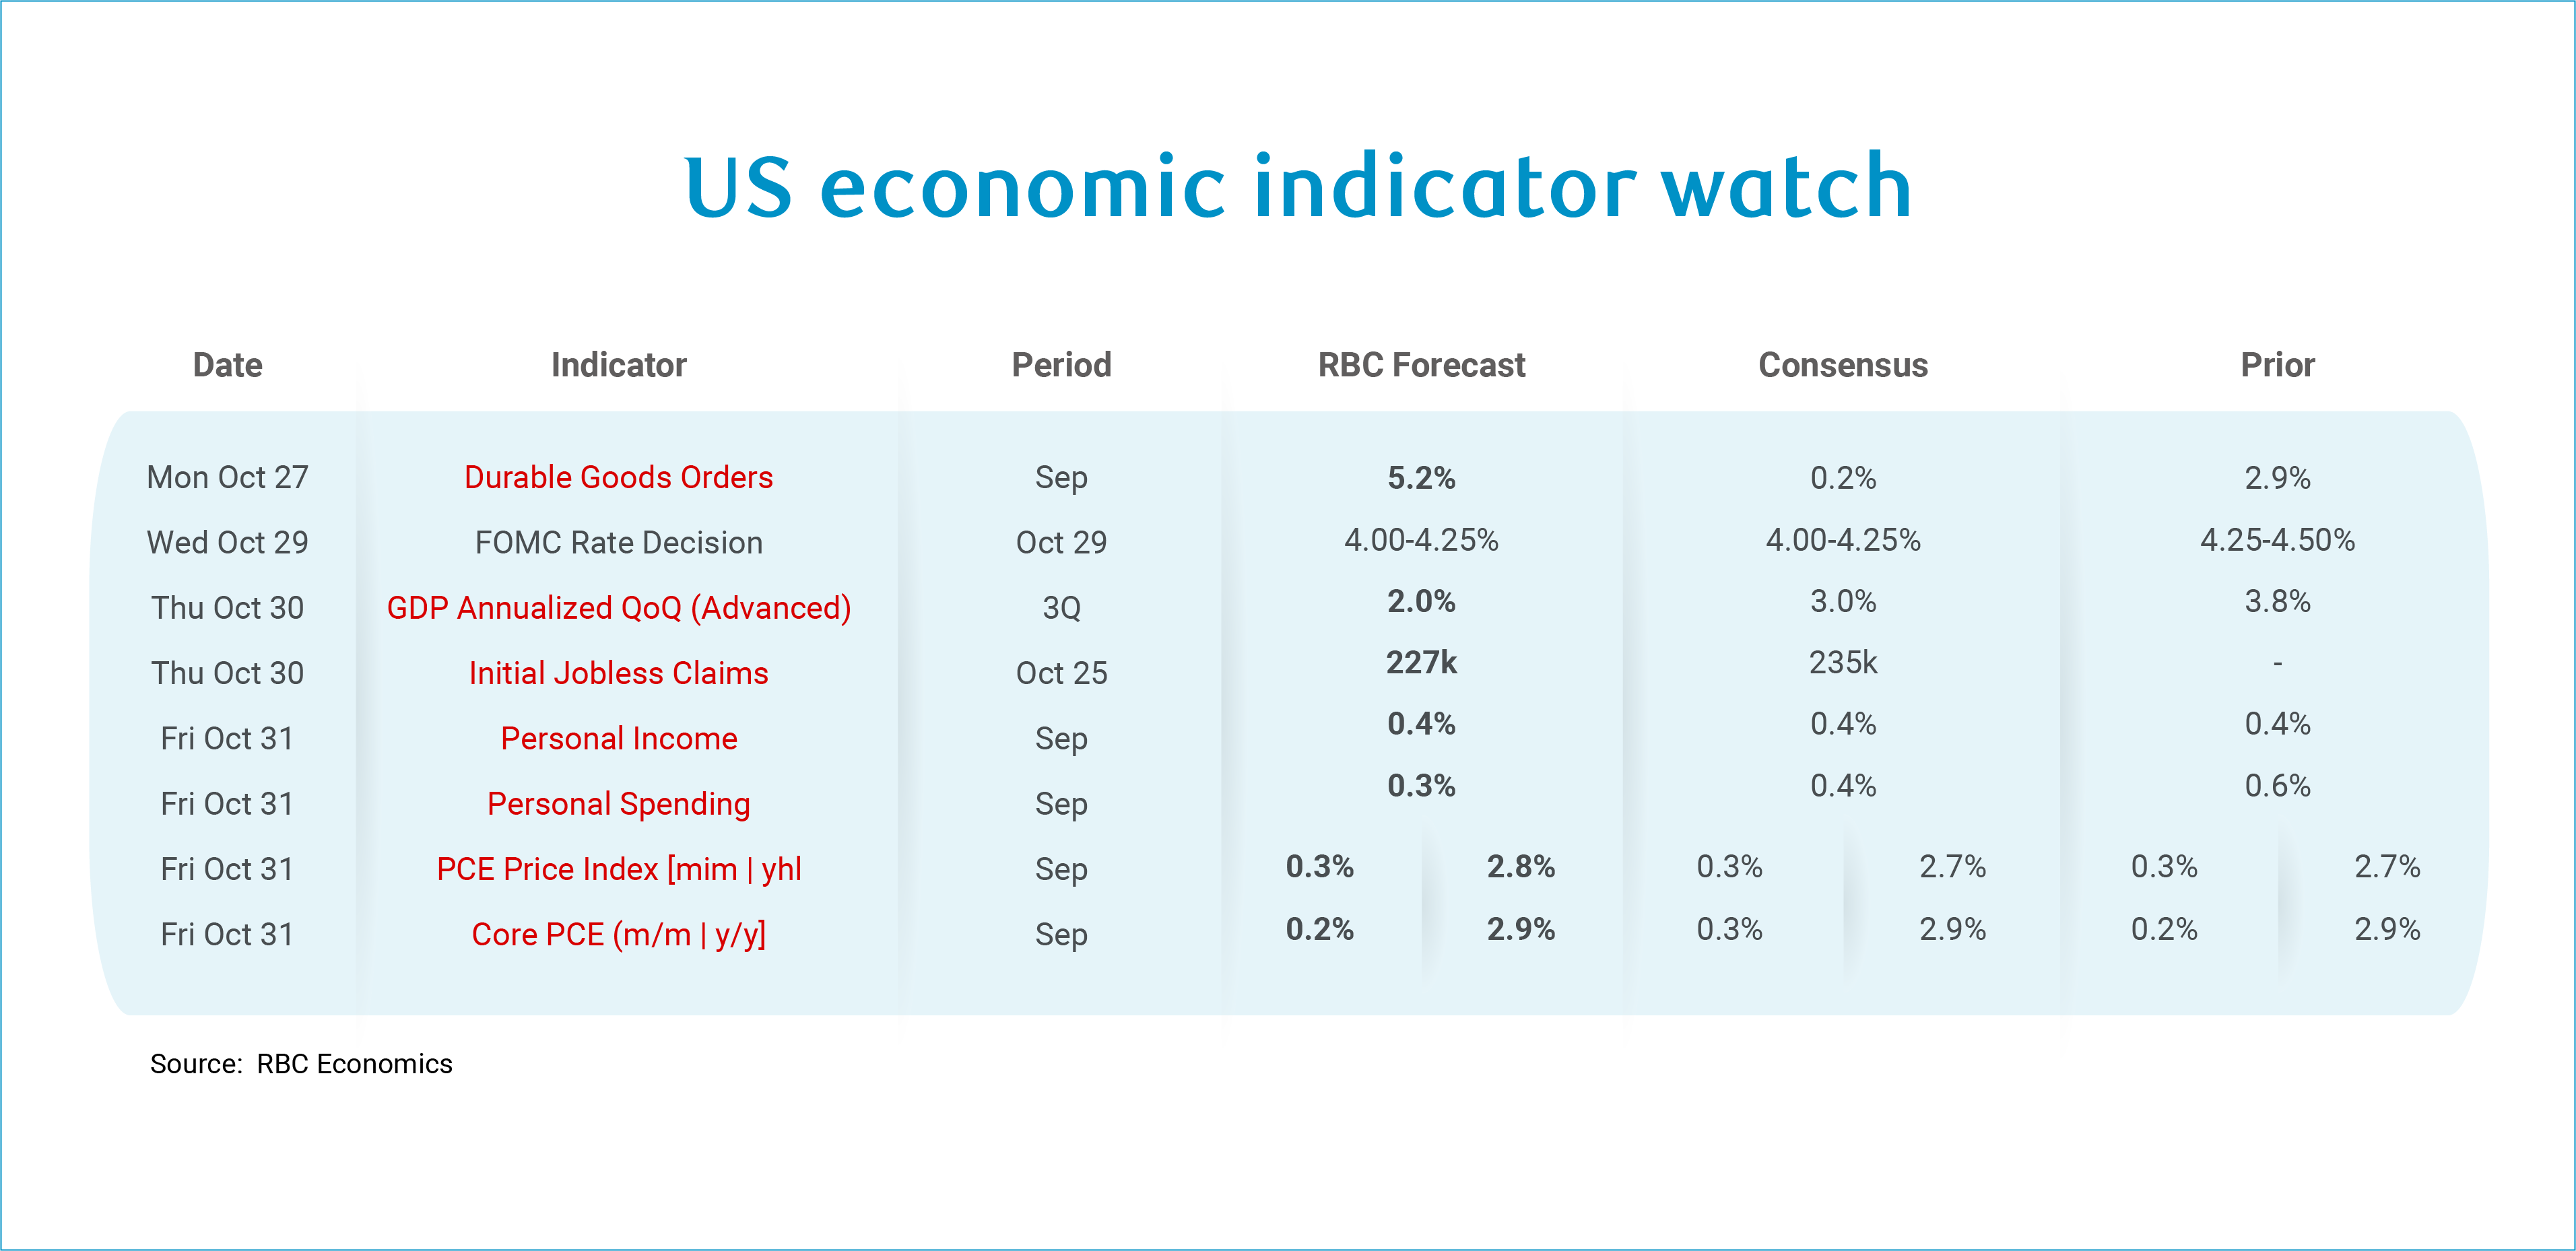
We are entering into the fourth week of the US government shutdown. We are continuing to publish our forecasts, with the government data highlighted below in red – this data will not be released during the shutdown.
We are expecting the Fed to go ahead with a 25-basis point cut next week. That being said, the Fed heads into next week’s meeting with a lack of official data on the labor side of their mandate. Specifically, they are missing the unemployment rate. Labor market data from recent months paints a picture of limited job creation outside of the non-structural health care sector but at the same time, the supply side of the equation has been slowing such that the breakeven rate has fallen considerably since 2024. If the labor market stabilizes as we expect, this will limit how far the Fed can lower interest rates in 2026.
Our current forecast calls for core inflation to reach 3.5% (from 3.0% currently) by mid-2026. With this in mind, we expect that the Fed likely only has a short window to lower rates before a re-acceleration in inflation necessitates a pause. We expect to see one of those cuts at the October meeting next week, with an additional two cuts coming by mid-2026 but look for the Fed to pause at the December meeting due in part to data disruptions caused by the shutdown.
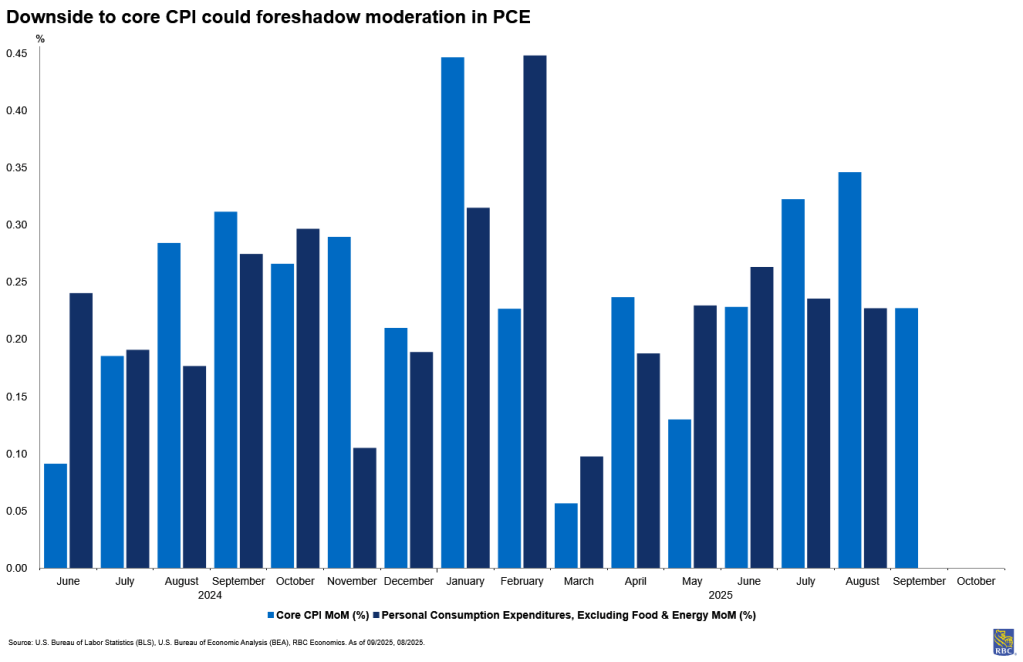
The September inflation release pointed to increasing signs of tariff pressures materializing, though a reprieve in OER helped moderate the core index. However, given differences in weighting, the housing component is less significant in PCE and this poses upside risk to the core PCE measure of inflation, especially if health care services measures of PPI come in higher than 0.1% month-over-month. Still, we expect core PCE to tick up by a modest +0.2% m/m in September, as we continue to see upward pressure in the CPI data in tariff-exposed sectors. And higher food and energy prices mean monthly growth in headline PCE should outpace core growth in September. At the same time, retirees and higher income consumers continue to support services spending, limiting the downside to core services inflation while the impact of tariffs continues to permeate through core goods. We expect these pressures to mount in tandem in the first half of 2026, with inflation peaking in Q2.
We have also included forecasts for the following (delayed) government data releases:
-
Personal Spending is expected to rise by 0.3%. We did not get retail sales data this month, but our assumption is for stronger nondurables spending with a pullback in durable home furnishings. We expect services spending growth to outpace goods spending, largely supported by retirees, who tend to spend more of their incomes on services.
-
Personal income is expected to continue to show robust growth (+0.4% m/m) as labor market tightness will continue to support wage growth. Still, wages and salaries are becoming a relatively less important source of income, as growth in non-labor sources (i.e., from dividends, rent and social security) has outpaced wage growth notably since 2019. We expect demographics will support this trend in the years to come making the K-Shaped phenomenon even more pronounced.
-
For the week ending October 25th, we expect to see ~227K jobless claims filed based on seasonal trends, an uptick from a week ago where state-level jobless claims came in quite a bit lower than weeks prior.
-
Durable Goods Orders likely ramped up in October, entirely reflective of an inflow of new Boeing orders.
About the Authors
Mike Reid is a Senior U.S. Economist at RBC. He is responsible for generating RBC’s U.S. economic outlook, providing commentary on macro indicators, and producing written analysis around the economic backdrop.
Carrie Freestone is an economist and a member of the macroeconomic analysis group. She is responsible for examining key economic trends including consumer spending, labour markets, GDP, and inflation.
Imri Haggin is an economist at RBC Capital Markets, where he focuses on thematic research. His prior work has centered on consumer credit dynamics and treasury modeling, with an emphasis on leveraging data to understand behavior.
This article is intended as general information only and is not to be relied upon as constituting legal, financial or other professional advice. The reader is solely liable for any use of the information contained in this document and Royal Bank of Canada (“RBC”) nor any of its affiliates nor any of their respective directors, officers, employees or agents shall be held responsible for any direct or indirect damages arising from the use of this document by the reader. A professional advisor should be consulted regarding your specific situation. Information presented is believed to be factual and up-to-date but we do not guarantee its accuracy and it should not be regarded as a complete analysis of the subjects discussed. All expressions of opinion reflect the judgment of the authors as of the date of publication and are subject to change. No endorsement of any third parties or their advice, opinions, information, products or services is expressly given or implied by Royal Bank of Canada or any of its affiliates.
This document may contain forward-looking statements within the meaning of certain securities laws, which are subject to RBC’s caution regarding forward-looking statements. ESG (including climate) metrics, data and other information contained on this website are or may be based on assumptions, estimates and judgements. For cautionary statements relating to the information on this website, refer to the “Caution regarding forward-looking statements” and the “Important notice regarding this document” sections in our latest climate report or sustainability report, available at: https://www.rbc.com/community-social-impact/reporting-performance/index.html. Except as required by law, none of RBC nor any of its affiliates undertake to update any information in this document.
