
The evolving landscape of U.S. trade policy continues to present significant challenges for Canadian exporters.
The Canada-United States-Mexico Agreement (CUSMA) has largely shielded trade flows—allowing 88% of Canadian goods to enter the U.S. duty-free in July. It has helped prevent a broader economic downturn, but this overall resilience masks stark disparities across sectors and regions.
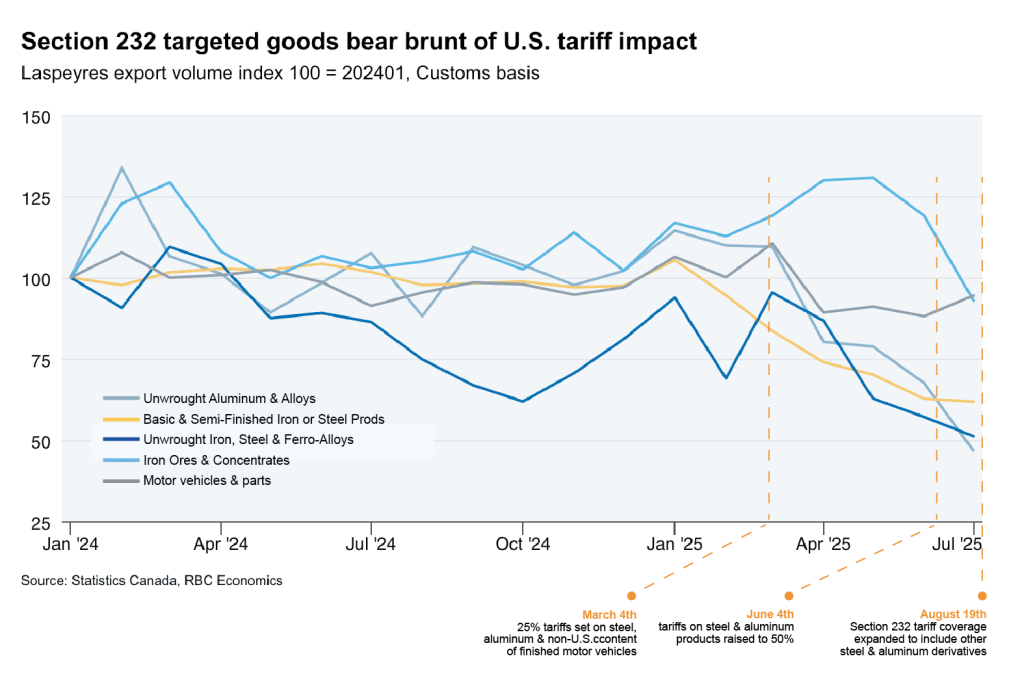
Targeted tariffs on steel, aluminum, and certain auto products have disproportionately impacted key manufacturing industries, amplifying pressure on provinces such as Ontario and Quebec, which are integral to Canada’s export and manufacturing base.
Recent developments including new U.S. tariffs on copper, Chinese tariffs on canola and other agricultural products, and expanded measures against steel and aluminum derivative products signal further risks ahead, highlighting the uneven nature of tariff exposure across Canada’s export landscape.
How tariff exposure varies across exports
Recent data on calculated duties for U.S. imports suggest that the average effective tariff on Canadian exports remains lower than most countries—around 3% as of July. This aggregate figure masks significant variation across product categories with some industries facing considerably steeper burdens than others.
Among Canadian exports, products subject to Section 232 tariffs—largely excluded from CUSMA exemptions—have borne the brunt of the impact.
In July alone, aluminum and aluminum articles incurred roughly US$188 million in duties, according to data from the U.S. Census Bureau. That corresponds to an average effective tariff of 32%—the highest among all Canadian exports to the U.S.
Similarly, exports of steel and steel articles (combined) faced total duties of US$189 million, while vehicles and parts incurred US$392 million, resulting in average effective tariffs of about 29% and 13%, respectively.
Beyond specifically targeted products, other items—such as aircraft and parts, machinery, and furniture—have also seen tariff rates rising in recent months. This could partly be due to some of these products being classified as derivative items containing embedded steel or aluminum, which partially subjects them to Section 232 tariffs.
A smaller share of exports may also be affected by International Emergency Economic Powers Act tariffs targeting non-CUSMA compliant goods. Taken together, U.S. tariffs work out to an average of 27% for the entire group of tariffed goods.
Manufacturing at the heart of weaker U.S. demand
Adverse effects of U.S. tariffs are most evident in Canada’s weakened manufacturing activity.
Real gross domestic product for the manufacturing sector has contracted by about 2.2% from January to June. The downturn has also taken a toll on the labour market with manufacturing employment shrinking by roughly 58,000 jobs since the start of the year.
Higher U.S. tariffs on steel, aluminum, and certain auto products have significantly reduced U.S. demand for Canadian exports. Between January and July, Canadian exports of steel and related products to the U.S. fell sharply—down about 22% compared to the same period in 2024. Similarly, exports of aluminum products declined by 7%, while exports of vehicles and parts contracted by 5% over the same timeframe1.
Efforts are underway to diversify trade and expand exports to alternative markets—Q2 saw an increase of aluminum product exports to regions like the European Union. But, these initiatives are expected to only partially offset the loss of U.S. market access in the short-term.
Overall, total international export volumes of goods affected by Section 232 tariffs have experienced a substantial annual decline.
Meanwhile, the downturn in exports to U.S. markets has not been sufficiently offset by stronger domestic sales, compounding the challenges.
Canadian real manufacturing sales declined in five of the last six months, falling 3.4% year-over-year in July. Real sales data from the first seven months of this year highlights pronounced contractions in sectors targeted by Section 232 tariffs. Primary metal and fabricated metal product sales are down over 4% compared to the same period in 2024, while sales of machinery and transportation equipment have declined by 2.4% and 1.7%, respectively.
The imposition of U.S. tariffs on steel has broadly increased the cost of steel for U.S. buyers. Prices have increased sharply for U.S. Midwest hot-rolled steel compared to similar offshore contracts. These higher prices have weakened U.S. demand for steel and contributed to a supply bottleneck, causing some Canadian-made steel products—normally destined for the U.S.—to accumulate in the domestic market. The surplus has led to industry challenges, including operating disruptions and growing financial losses.
In contrast, the aluminum market may be more resilient. Canadian aluminum exports to the U.S. have declined, but insufficient U.S. domestic production and limited alternatives have driven U.S. aluminum prices higher, helping mitigate Canadian export losses.
Canada accounts for a hefty 56% of U.S. aluminum imports, highlighting its critical role in the U.S. supply chain.
Regional impact concentrated in Ontario and Quebec
The concentrated nature of current U.S. tariffs is hitting some provincial exports harder than others.
Our calculations suggest that manufacturing-heavy provinces such as Ontario and Quebec are experiencing the highest average effective tariffs on exports to the U.S. (based on U.S.-calculated duties)—well above the national average.
Steel and aluminum industries account for a relatively small share of provincial real GDPs—about 1.3% in Quebec and 0.5% in Ontario. But, tariffs are having a significant impact on some manufacturing-dependent communities in these provinces.
Most of Canada’s manufacturing job losses have been concentrated in Ontario (59%), and Quebec (22%). In Ontario, the downturn has been particularly acute in the southwestern region—its hub for manufacturing activity. Cities such as Windsor (11.1%) and Oshawa (9%) are experiencing the highest unemployment rates among Canada’s largest census metropolitan areas.
Provincial exports to the U.S. of products subject to Section 232 tariffs have also weakened considerably.
Steel products and vehicles and parts are among the most affected. Ontario has seen export declines of more than 24% and 5% of these products, respectively, from January to July compared to the same period last year. Similarly, aluminum exports from Quebec—Canada’s largest aluminum-exporting province—fell by 9.3% over the same timeframe.
Tariff exposure could increase
Looking ahead, average effective tariffs on specific products and provincial exports are set to increase.
In August, the U.S. introduced a 50% tariff on copper products, and widened the scope of items categorized as derivatives of steel and aluminum. This expanded list now includes more downstream goods such as furniture, machinery, and various other products, making them partially subject to Section 232 tariffs based on their steel or aluminum content.
Newly imposed U.S. tariffs on Canadian copper exports are expected to affect about $3.7 billion in annual trade, based on projected 2024 export flows. Of this total, about $2.7 billion originates from Quebec, accounting for 2.2% of the province’s total merchandise exports in 2024.
At the same time, announced anti-dumping and countervailing duties on Canadian lumber exports could add further strain to British Columbia’s forestry sector, which is already dealing with weakened activity.
The Prairies and Atlantic provinces have faced comparatively lower average effective tariffs on exports to the U.S., but these regions are grappling with trade challenges from other sources—most notably Chinese tariffs.
For example, some 9.1% of Newfoundland and Labrador’s total exports are subject to Chinese tariffs since China is the province’s second-largest export market for seafood like lobster. Similarly, recent increases in Chinese tariffs on canola seed exports—with China being Canada’s largest market for the commodity—have left nearly 6.3% of Saskatchewan’s total exports exposed to higher tariffs.
- Steel and related products (HS 72 and 73), aluminum products (HS 76), and motor vehicles and parts (HS 87). ↩︎
About the Author
Salim Zanzana is an economist at RBC. He focuses on emerging macroeconomic issues, ranging from trends in the labour market to shifts in the longer-term structural growth of Canada and other global economies.
This article is intended as general information only and is not to be relied upon as constituting legal, financial or other professional advice. The reader is solely liable for any use of the information contained in this document and Royal Bank of Canada (“RBC”) nor any of its affiliates nor any of their respective directors, officers, employees or agents shall be held responsible for any direct or indirect damages arising from the use of this document by the reader. A professional advisor should be consulted regarding your specific situation. Information presented is believed to be factual and up-to-date but we do not guarantee its accuracy and it should not be regarded as a complete analysis of the subjects discussed. All expressions of opinion reflect the judgment of the authors as of the date of publication and are subject to change. No endorsement of any third parties or their advice, opinions, information, products or services is expressly given or implied by Royal Bank of Canada or any of its affiliates.
This document may contain forward-looking statements within the meaning of certain securities laws, which are subject to RBC’s caution regarding forward-looking statements. ESG (including climate) metrics, data and other information contained on this website are or may be based on assumptions, estimates and judgements. For cautionary statements relating to the information on this website, refer to the “Caution regarding forward-looking statements” and the “Important notice regarding this document” sections in our latest climate report or sustainability report, available at: https://www.rbc.com/community-social-impact/reporting-performance/index.html. Except as required by law, none of RBC nor any of its affiliates undertake to update any information in this document.
