
The Bottom Line:
A plunge in Q2 Canadian export volumes is on track to substantially subtract from Canadian GDP in Q2 following a pre-tariff surge in Q1 when U.S. importers rushed to front-run tariffs. But there was further (encouraging) evidence in June that an exemption for trade compliant with the USMCA/CUSMA free trade agreement is backstopping duty free access to the U.S. market for most Canadian exports.
Sector specific tariffs on U.S. imports from Canada of products like steel and aluminum and the non-U.S. content of finished motor vehicles are raising costs significantly for U.S. buyers, but the U.S. census bureau reported 92% of Canadian exports to the U.S. crossed the border duty free in June — up slightly from 91% in May and 89% in April.
The average effective U.S. tariff rate on imports from Canada remained one of the lowest among U.S. trading partners at 2.4% — well-below the 8.9% average U.S. rate on all imports in June. That effective tariff rate on imports from Canada will rise with an increase in the rate on products not compliant with the USMCA/CUSMA to 35% in August (from 25% in June) but that increase applies to a relatively small share (we estimate ~6%) of exports to the U.S. that are not USMCA compliant.
We continue to expect that current rules, if maintained as currently in place, would leave Canada with the lowest tariff rate of any major U.S. trade partner — putting Canadian exporters in a stronger relative position to compete for U.S. import market share than other countries. The concern remains, though, that US tariff hikes have been so large —and uncertainty so high surrounding their announcements—that US economic growth will slow with negative implications for close U.S. trade partners like Canada.
The total U.S. effective tariff rate on imports from all countries continued to rise in June, hitting its highest level since the 1940s, and there is early evidence that U.S. labour markets are softening as a result, particularly in the U.S. industrial sector where ties with the Canadian economy are extremely close.
The June details:
-
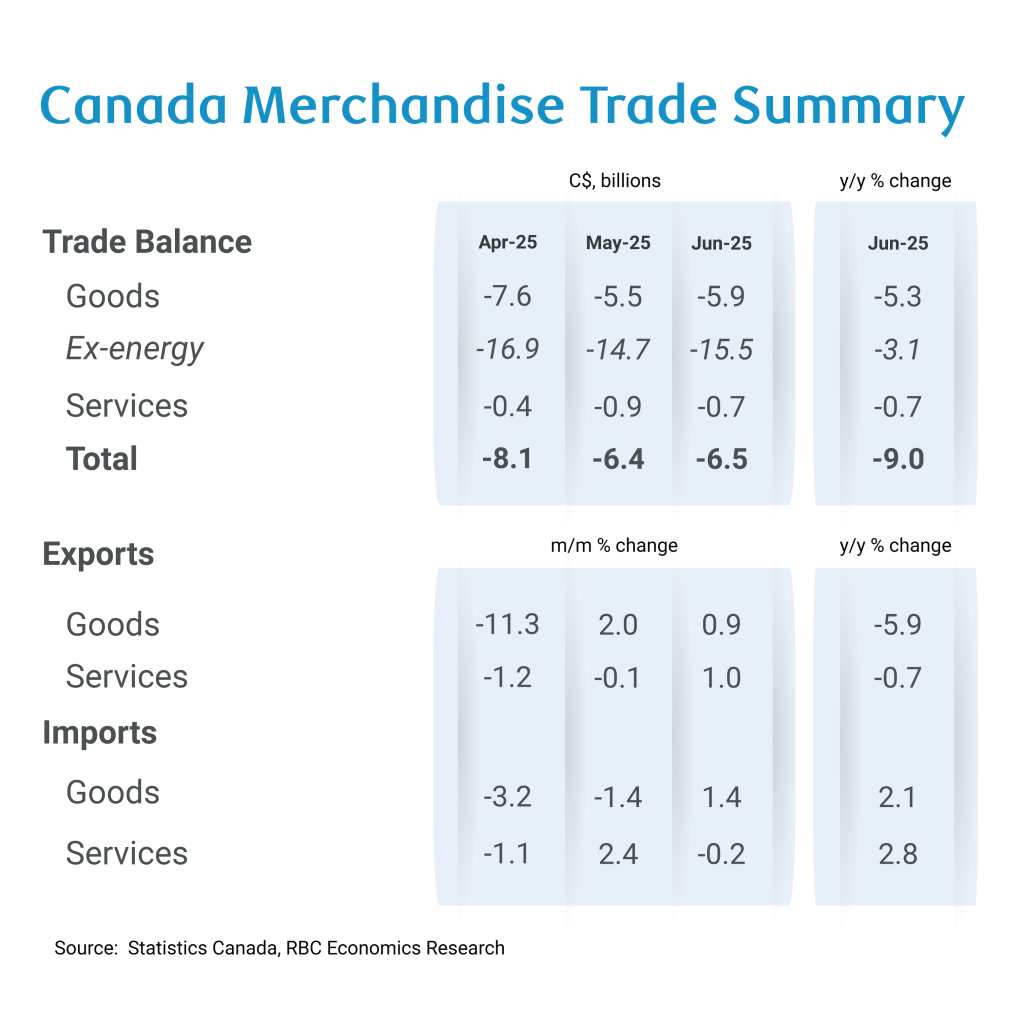
The Canadian trade deficit widened to $5.9 billion in June from a $5.5 billion shortfall in May, but reportedly entirely due to a large “one time high-value” equipment import from the United States to Newfoundland’s offshore oil production sector.
-
Excluding a $2.1 billion jump in the equipment import component that contained that product (logging, construction, mining, and oil and gas field equipment), imports of goods would have declined by another 1.8% in June, and the trade deficit would have narrowed to $3.8 billion overall.
-
That large equipment purchase should not impact overall GDP estimates — the import increase will mechanically subtract from GDP, but should be offset by higher business equipment spending.
-
Canadian exports rose 0.9% in June, but largely due to higher oil prices. Export volumes declined 0.6% following a 2.5% increase in May that only partially retraced an 8.6% plunge in April.
-
Exports to the United States rose 3.1% in June but were still down 12.5% from a year ago.
-
In Q2 as a whole, Canadian export volumes plunged a whopping 31.4% at an annualized rate. Imports fell by a smaller 5.7%, leaving net merchandise trade on track to subtract substantially (potentially 6%+) from Canadian Q2 GDP growth.)
-
Preliminary total GDP estimates are suggesting that GDP overall was unchanged — softer than the 2.2% increase in Q1 but avoiding an outright decline offset to net trade weakness from a build in inventories and relatively resilient consumer spending.
About the Author
Nathan Janzen is an Assistant Chief Economist, leading the macroeconomic analysis group. His focus is on analysis and forecasting macroeconomic developments in Canada and the United States.
This article is intended as general information only and is not to be relied upon as constituting legal, financial or other professional advice. The reader is solely liable for any use of the information contained in this document and Royal Bank of Canada (“RBC”) nor any of its affiliates nor any of their respective directors, officers, employees or agents shall be held responsible for any direct or indirect damages arising from the use of this document by the reader. A professional advisor should be consulted regarding your specific situation. Information presented is believed to be factual and up-to-date but we do not guarantee its accuracy and it should not be regarded as a complete analysis of the subjects discussed. All expressions of opinion reflect the judgment of the authors as of the date of publication and are subject to change. No endorsement of any third parties or their advice, opinions, information, products or services is expressly given or implied by Royal Bank of Canada or any of its affiliates.
This document may contain forward-looking statements within the meaning of certain securities laws, which are subject to RBC’s caution regarding forward-looking statements. ESG (including climate) metrics, data and other information contained on this website are or may be based on assumptions, estimates and judgements. For cautionary statements relating to the information on this website, refer to the “Caution regarding forward-looking statements” and the “Important notice regarding this document” sections in our latest climate report or sustainability report, available at: https://www.rbc.com/community-social-impact/reporting-performance/index.html. Except as required by law, none of RBC nor any of its affiliates undertake to update any information in this document.
