
The Bottom Line:
Canada’s international trade flows remain depressed in the wake of U.S. tariff hikes, although net trade is still showing signs of stabilizing to-date in Q3.
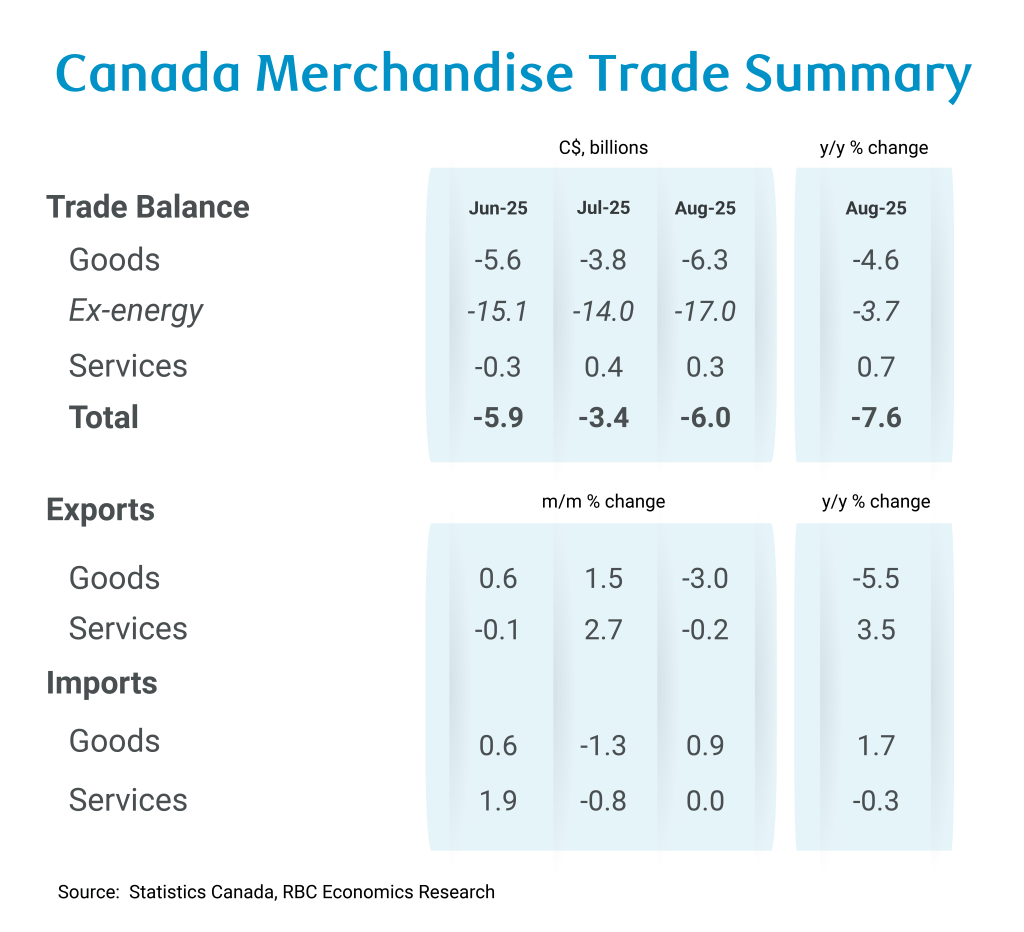
The goods trade deficit widened back to $6.3 billion in August, the second largest shortfall on record, behind only April’s $7.6 billion deficit in the immediate aftermath of the U.S. administration’s broad-based global ‘reciprocal tariff’ announcement.
Trade in specific products impacted by tariffs continue to be disrupted, and the timing of U.S. tariff announcements is adding significant volatility to monthly trade flows as importers and exporters pulled forward shipments to get ahead of expected tariff hikes. Exports of copper ore and lumber both plunged in August as new U.S. tariffs took effect.
And part of the deterioration in net trade reflects resilient imports — which increased 0.9% in August as higher consumer good imports (a sign of resilient consumer spending) offset weakness in equipment imports (a sign of continued softness in business investment.)
Looking through that volatility net trade is still unlikely to repeat the record subtraction that pushed overall GDP down 1.6% (annualized) in Q2 — net trade volumes over July and August combined are still tracking an add of ~1 percentage point to GDP growth from net trade in Q3.
But that really just means that net trade is not getting worse, not that it’s getting better. The BoC highlighted the evolution of exports as a key indicator helping to guide whether to cut interest rates again after a reduction in September, and the 3% drop in export volumes in August won’t be reassuring for the central bank. Still other key economic reports including this Friday’s labour market data and the next round of inflation data will also be watched closely ahead of the next policy decision.
The August details:
-
The Canadian goods trade deficit widened to $6.3 billion in August, led by a 3% pullback in exports and 0.9% rise in imports.
-
In volume terms (chained), exports fell 3.2% from July with imports edging up 0.2%.
-
Trade flows remain highly volatile, particularly in sectors impacted directly by tariffs. Exports to the U.S. fell by 3.4% after three straight monthly increases, and were down 8% from a year ago. Exports to non-U.S. destinations were up 1.8% from a year ago, but down 2% from July in August.
-
Exports of motor vehicles and parts fell by 3.9% after a 6.4% jump in July (and were down 5.3% from a year ago.)
-
Copper exports plunged 27% in August following a 35% jump in July. Lumber exports fell by 25% after rising 19% in July and were down 17% from a year ago.
-
Unwrought gold shipments accounted for most of a 7.6% drop in metal and non-metallic mineral shipments — that decline was almost entirely accounted for by lower sales to the U.S. as U.S. imports of gold broadly remain highly volatile.
-
Imports remained significantly more resilient, rising 0.9% despite an almost 13% drop in energy imports. A jump in metal imports accounted for much of the (ex-energy) import increase, but consumer goods imports also rose by 2.3%, consistent with a relatively resilient consumer demand backdrop.
-
The U.S. government shutdown means that important details on the impact of U.S. tariff policy in August are (for now) unavailable — detailed data on tariffs on U.S. imports by country and product are only available from U.S. statistics sources that are not providing data due to the shutdown. But to-date, an exemption from most tariffs for CUSMA compliant trade has allowed the majority of Canadian exports to the U.S. to cross the border duty free, and that likely continued in August.
About the Author
Nathan Janzen is an Assistant Chief Economist, leading the macroeconomic analysis group. His focus is on analysis and forecasting macroeconomic developments in Canada and the United States.
This article is intended as general information only and is not to be relied upon as constituting legal, financial or other professional advice. The reader is solely liable for any use of the information contained in this document and Royal Bank of Canada (“RBC”) nor any of its affiliates nor any of their respective directors, officers, employees or agents shall be held responsible for any direct or indirect damages arising from the use of this document by the reader. A professional advisor should be consulted regarding your specific situation. Information presented is believed to be factual and up-to-date but we do not guarantee its accuracy and it should not be regarded as a complete analysis of the subjects discussed. All expressions of opinion reflect the judgment of the authors as of the date of publication and are subject to change. No endorsement of any third parties or their advice, opinions, information, products or services is expressly given or implied by Royal Bank of Canada or any of its affiliates.
This document may contain forward-looking statements within the meaning of certain securities laws, which are subject to RBC’s caution regarding forward-looking statements. ESG (including climate) metrics, data and other information contained on this website are or may be based on assumptions, estimates and judgements. For cautionary statements relating to the information on this website, refer to the “Caution regarding forward-looking statements” and the “Important notice regarding this document” sections in our latest climate report or sustainability report, available at: https://www.rbc.com/community-social-impact/reporting-performance/index.html. Except as required by law, none of RBC nor any of its affiliates undertake to update any information in this document.
