Oil and gas markets are reeling as the Iran war chokes off production in the Middle East, with its impact reverberating across the world. As energy supply chains get fractured and prices become volatile, we examine the emerging trends defining this new era of global energy insecurity.
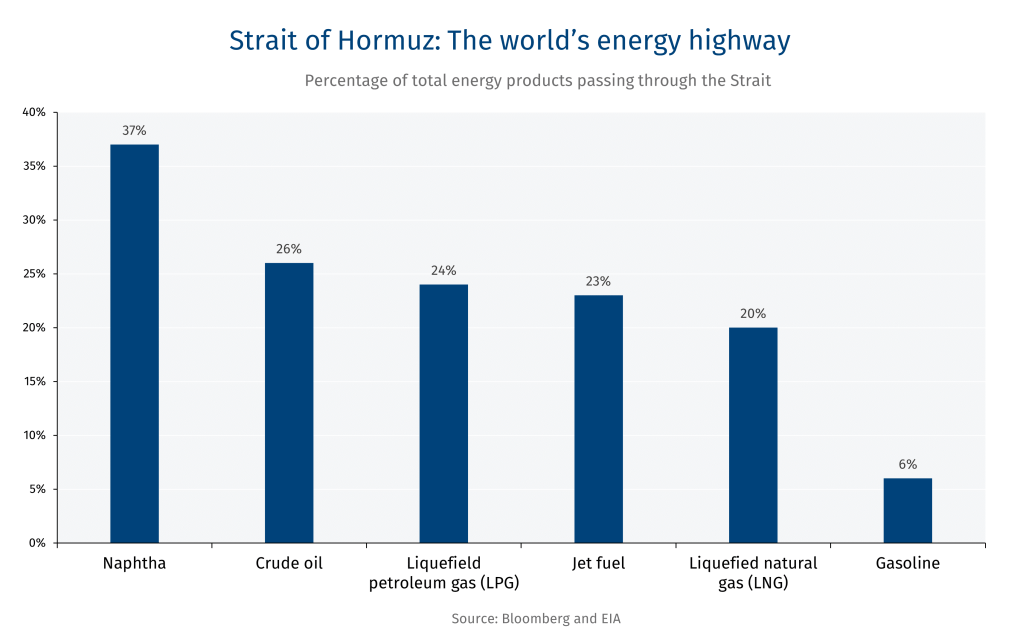
The Strait of Hormuz is one of the world’s most critical trade arteries—but also one of its weakest links given the frequency of conflicts in the Middle East
-
Alternative Middle East export routes have limited capacity of 3.5 to 5.5 million bpd.
-
The 54-kilometre waterway handles 20 million barrels per day (bpd) or 20% of global oil supply. Only the Strait of Malacca, in Southeast Asia, handles more crude oil.
-
Close to 93% of Qatar’s LNG exports transit through the Strait—19% of global LNG trade.
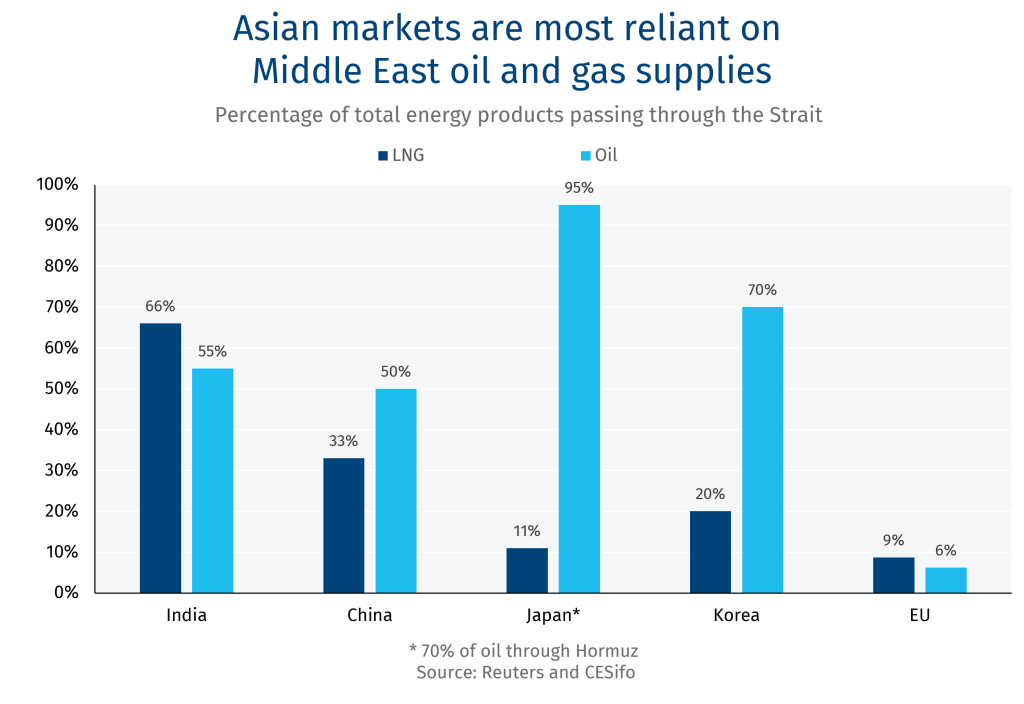
Energy hungry Asian countries are most exposed to the Middle East crisis
-
Japan was the first country to announce the release of oil from its reserves as part of the International Energy Agency-coordinated action, injecting 80 million barrels in the market.
-
The U.S. is allowing India to buy Russian oil as a stop-gap measure—as New Delhi scrambles to find alternatives for some of the 2.5-2.7 million bpd it sources from Iraq, UAE, Saudi Arabia and Kuwait.
-
The U.S. has exempted Russian oil from sanctions for at least 30 days—weakening Western efforts to support Ukraine in its war against Russia.
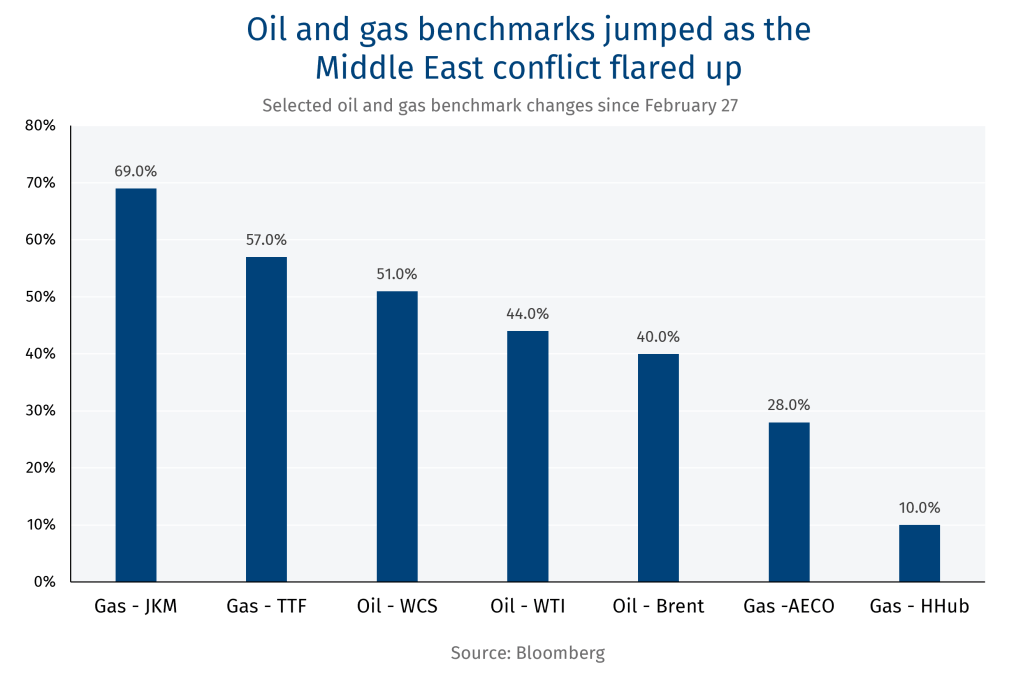
Crude and natural gas benchmarks have risen as the U.S.-Israel war on Iran spread to the wider region—even impacting North American commodity indices
-
LNG Japan/Korea Marker (JKM) jumped the most, underscoring Asian dependence on the Strait.
-
The crisis has erased a looming LNG supply glut, with Europe Asia scrambling for supplies.
-
Oil prices remain volatile, vacillating between US$76-119 per barrel over the past week.
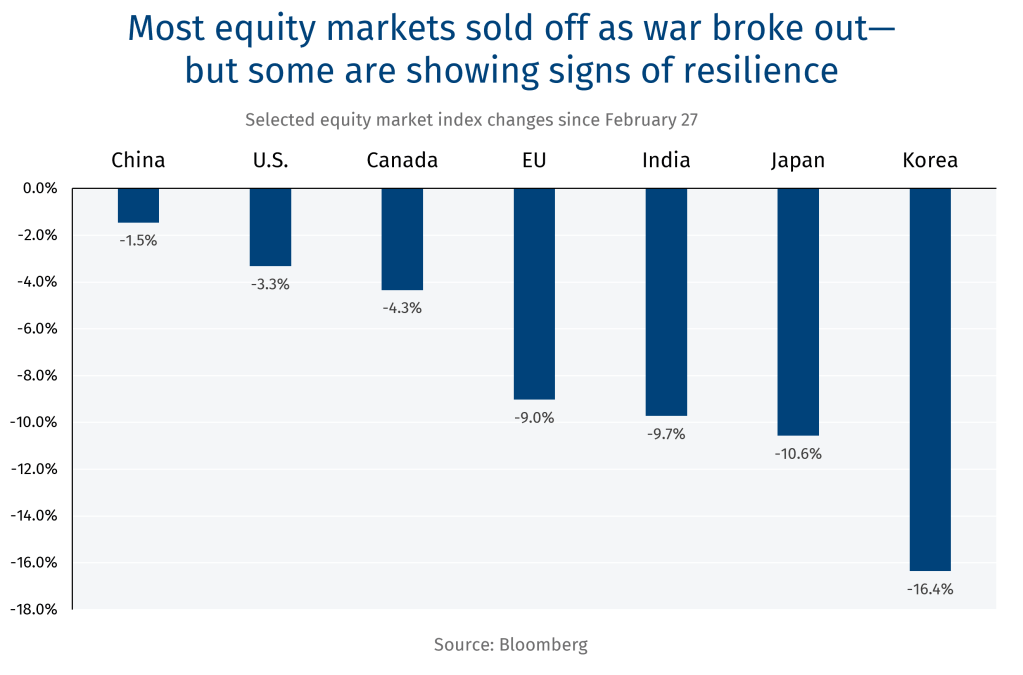
Investors are actively reallocating capital to economies less exposed to the conflict, to nations with greater energy security—such as North American markets
-
The Korean and Japanese stock market sell-off is reflective of energy exposure but also above-average year-to-date performance pre-crisis.
-
China’s estimated 100-day oil import cover has shielded its stock market from a severe downturn.
-
U.S. and Canada markets have been structural winners in the reallocation of global equities.
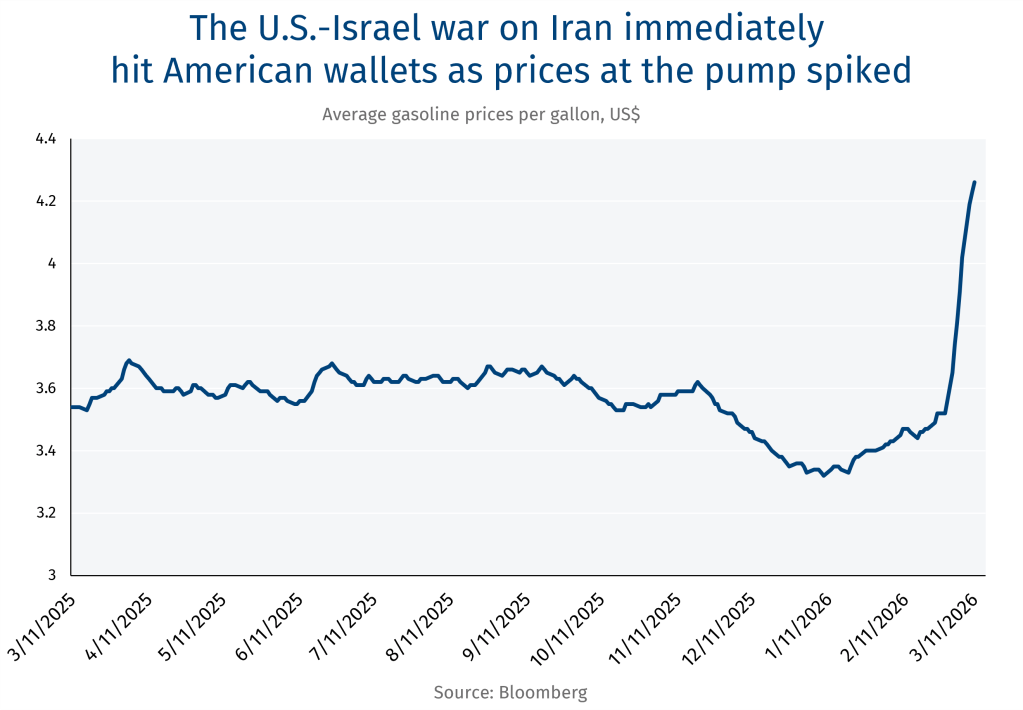
American consumers are also paying the price of a conflict thousands of miles away
-
While North America’s net exporter of crude oil, the global structure of oil markets has not spared the American economy
-
A recent Washington Post/CNN poll shows about 7 in 10 American voters are “very” or “somewhat” concerned that the Iran war will send oil and gasoline prices higher
-
Higher gasoline prices would be a key datapoint for the U.S. administration as it plots it next move.
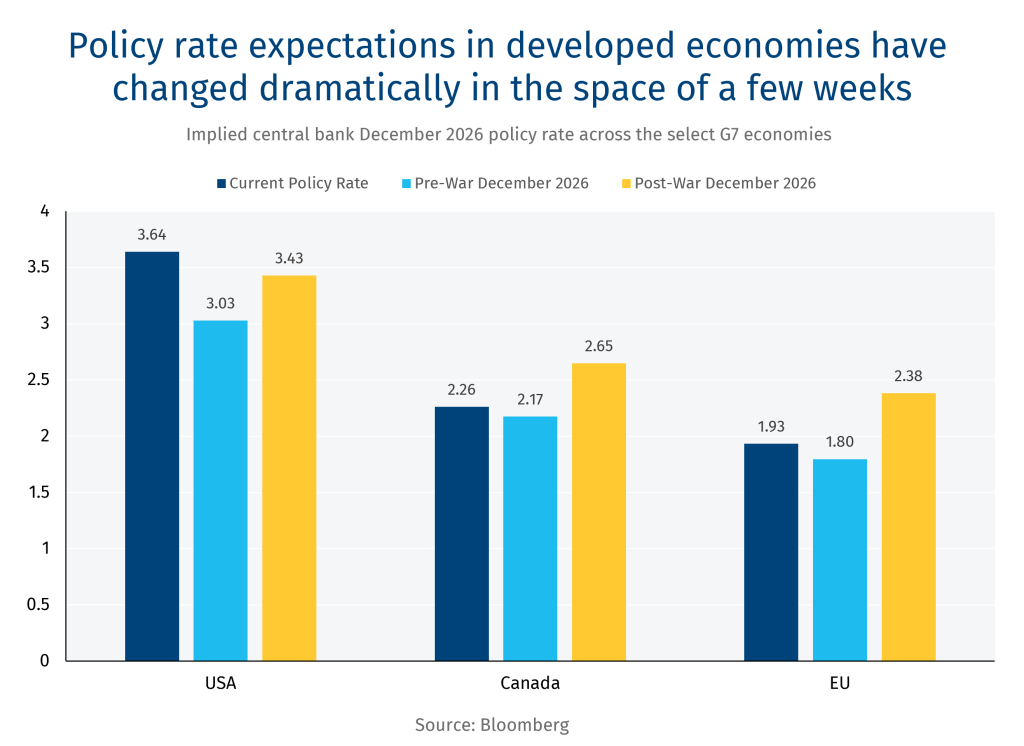
Central banks are suddenly contemplating hikes—not cuts, according to market expectations
-
Across Canada, the U.S. and EU, the expectation was an easing of monetary policy as the year progressed—but it has reversed on fears of higher inflation.
-
A sustained US$80 oil could raise inflation from 2.2% to 2.5% in Canada, according to RBC Economics.
-
Similarly, the U.S. would see an increase from 2.7% to 3.1% at US$80 per barrel.
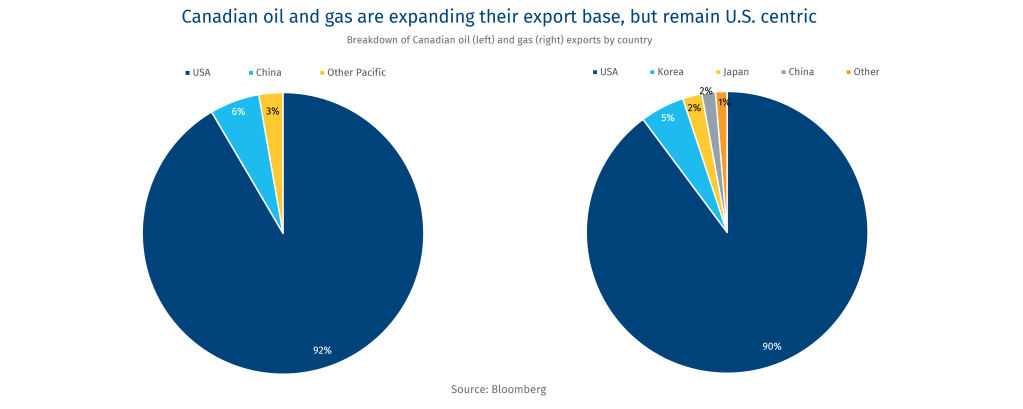
Canadian energy has already been making inroads into the Asian market
-
China has been Canada’s biggest non-U.S. oil export destination—which could grow further as relations with Beijing improve.
-
South Korea has been the primary destination for Canadian LNG to date.
-
Over the long term, Canada could likely serve a more meaningful role in de-risking Asian supply.
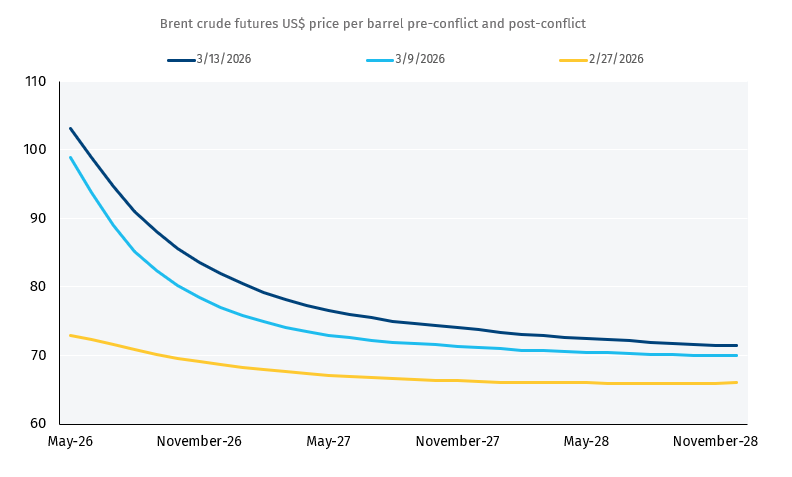
Brent Future curve suggests oil prices will remain higher for longer
-
Around 8 million barrels per day of crude and 10 mbd of liquids production in the Middle East is reportedly shut in with the Strait of Hormuz at a virtual standstill, according to the International Energy Agency.
-
Despite International Energy Agency members planning 400-million-barrel injection into markets, the price trajectory would likely depend on the U.S.’s ability to ensure the security of the Strait of Hormuz.
Shaz Merwat, is the Energy Policy Lead for RBC Thought Leadership
This article is intended as general information only and is not to be relied upon as constituting legal, financial or other professional advice. The reader is solely liable for any use of the information contained in this document and Royal Bank of Canada (“RBC”) nor any of its affiliates nor any of their respective directors, officers, employees or agents shall be held responsible for any direct or indirect damages arising from the use of this document by the reader. A professional advisor should be consulted regarding your specific situation. Information presented is believed to be factual and up-to-date but we do not guarantee its accuracy and it should not be regarded as a complete analysis of the subjects discussed. All expressions of opinion reflect the judgment of the authors as of the date of publication and are subject to change. No endorsement of any third parties or their advice, opinions, information, products or services is expressly given or implied by Royal Bank of Canada or any of its affiliates. This document may contain forward-looking statements within the meaning of certain securities laws, which are subject to RBC’s caution regarding forward-looking statements. ESG (including climate) metrics, data and other information contained on this website are or may be based on assumptions, estimates and judgements. For cautionary statements relating to the information on this website, refer to the “Caution regarding forward-looking statements” and the “Important notice regarding this document” sections in our latest climate report or sustainability report, available at: https://www.rbc.com/our-impact/sustainability-reporting/index.html. Except as required by law, none of RBC nor any of its affiliates undertake to update any information in this document.