
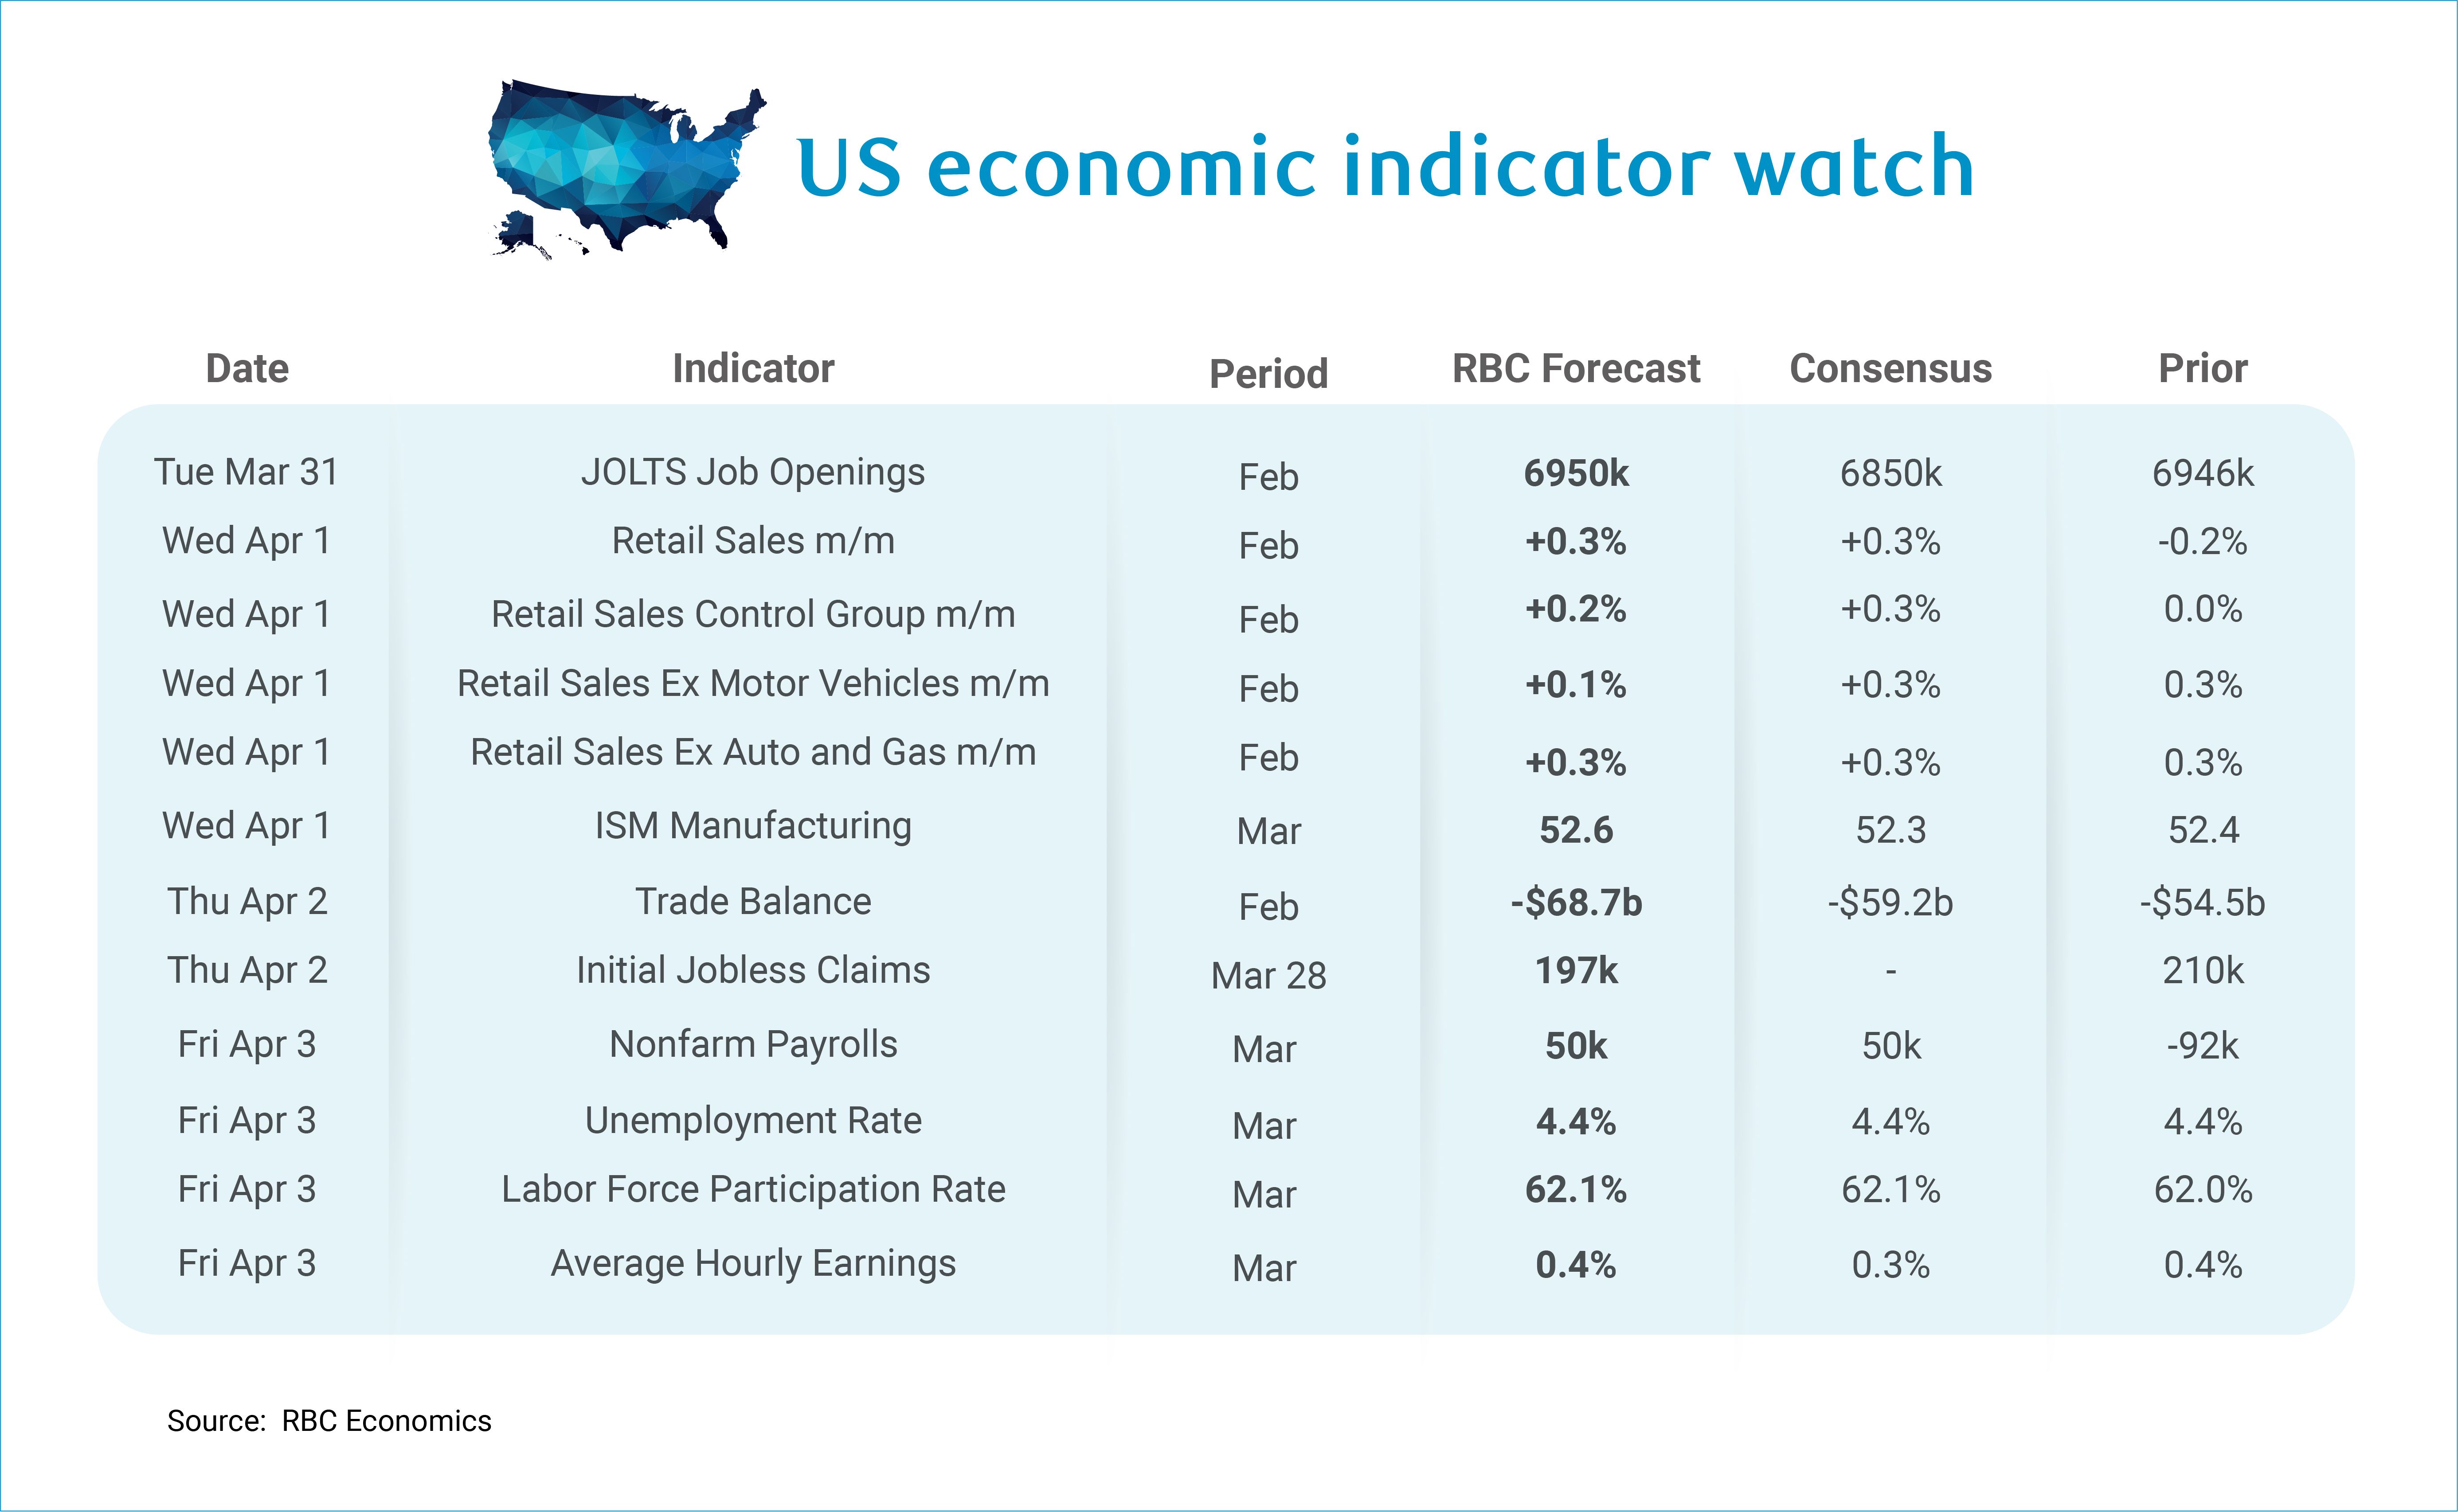
Next week will provide more clues about the trajectory of the US labor market – we expect to see payroll growth rebound to 50k with the unemployment rate holding steady at 4.4% in March.
In February, a nurses’ strike in California resulted in -34k jobs subtracting from the health care sector, but it ended February 23rd,so those jobs will be added back payrolls in March. This means that we are likely to see an exceptionally strong gain in the health care sector this month. But outside of health care, the US labor market has not been meaningfully creating new jobs and we expect that trend to continue in March. The uncertainty added by the geopolitical events in the Middle East are likely to weigh on hiring activity in trade and transport sectors, which have already been shedding jobs for months.
A lack of net new job creation is not problematic at this juncture – we estimate the pace of monthly breakeven job growth in 2026 is exceptionally low (likely flat to 30k) due to the slowdown in immigration as well as the record number of retirements. This means that the US economy needs to add very few jobs for the unemployment rate to hold steady. A hire made to backfill a retiring worker does not count as a “new job” in the data. Since we are witnessing a massive wave of retirements (roughly 160k per month), there is a significant amount of hiring beneath the surface that does not show up as payroll growth. Put differently, the headline print understates actual labor market tightness because backfill hiring is masked by churn.
The current concentration of job growth in health care has become more problematic given that trade-exposed sectors have been shedding jobs for 11 of the past 12 months. Even sectors insulated from trade exposure, such as finance and information employment are hiring at a tepid pace. Structural hiring continues to mask this cyclical weakness, and the skew toward a single sector raises concerns around skills mismatches for recent graduates. If entry-level hiring is concentrated in health care, new entrants trained in other fields face will see limited opportunities to enter the labor market.
Focusing on the near-term, we continue to expect to see trade-exposed sectors shed jobs, with a particular risk for transportation reliant sectors, as fuel prices remain elevated. Construction has been the outlier for hiring within the goods sector because the continued demand for non-residential construction (i.e., data centers) has sustained demand.
The unemployment rate is unlikely to move in the month of March if jobless claims are any indication. Continuing claims fell slightly between the reference weeks for February and March and initial jobless claims held steady. This is consistent with our expectation that the unemployment rate will hold steady despite the relatively weak headline payroll growth.
Outside of payrolls, here’s what we’re watching next week:
-
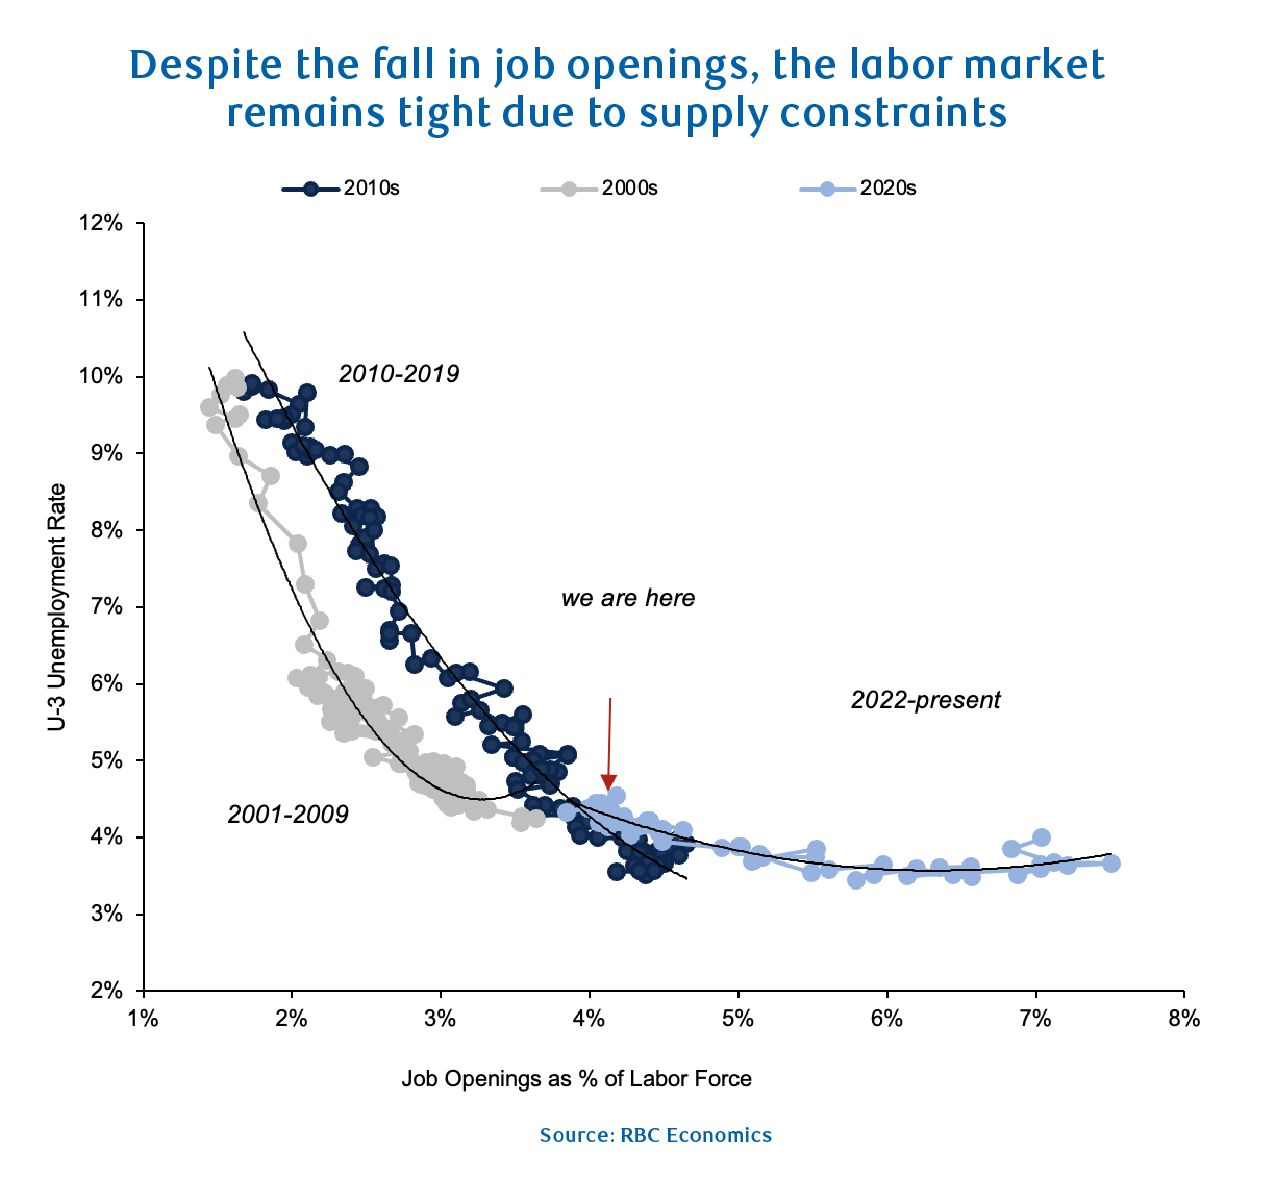
JOLTS job openings data for February will be stale, but we anticipate that the data will show job postings were flat, aligned with what we saw in posting activity from Indeed Hiring Labs. The Beveridge curve (depicted below) represents the relationship between job openings and the unemployment rate. In the aftermath of the GFC and ahead of the pandemic, the US economy could be depicted by the steep portion of the curve where relatively high unemployment was met with fewer job openings. Today, we are sitting on a much flatter portion of the Beveridge curve where the unemployment rate is less sensitive to ramp ups in job openings, since available labor supply is limited by retirements and more stringent immigration.
-
We anticipate headline February retail sales rose +0.3% m/m with the control group slightly weaker at +0.2%. The Visa Spending Momentum Index showed non-discretionary spending (which has tracked closely with the control group) moved meaningfully higher in February. Restaurant spending, on the other hand, was likely impacted by inclement weather throughout the Midwest and Northeast US in February, and we expect to see weaker spending as a result.
-
The US trade deficit likely widened in February (we expect to -$68.7b). SCOTUS struck down IEEPA tariffs on February 20th, opening a window for firms to import goods without paying tariffs. That said, Section 122 tariffs were subsequently implemented on February 24th, but we expect that there could have been some unloading of bonded warehouses during that window as firms attempt restock tariff-free where possible.
-
We expect that to see a dip in US jobless claims to 197K for the week of March 28th. The low hire backdrop is expected to continue despite the increased uncertainty created by the conflict in the Middle East.
-
We expect to see an acceleration in the ISM Manufacturing index in March to 52.6. All five regional Fed manufacturing surveys (Richmond, Kansas City, Texas, Empire and Philly) showed improvements in March.
About the Authors
Mike Reid is Head of U.S. Economics at RBC. He is responsible for generating RBC’s U.S. economic outlook, providing commentary on macro indicators, and producing written analysis around the economic backdrop.
Carrie Freestone is a Senior US Economist at RBC Capital Markets. Carrie is responsible for projecting key US indicators including GDP, employment, consumer spending and inflation for the US. She also contributes to commentary surrounding the US economic backdrop which she delivers to clients through publications, presentations, and the media.
Imri Haggin is an Economist at RBC Capital Markets, where he focuses on thematic research. His prior work has centered on consumer credit dynamics and treasury modeling, with an emphasis on leveraging data to understand behavior.
This article is intended as general information only and is not to be relied upon as constituting legal, financial or other professional advice. The reader is solely liable for any use of the information contained in this document and Royal Bank of Canada (“RBC”) nor any of its affiliates nor any of their respective directors, officers, employees or agents shall be held responsible for any direct or indirect damages arising from the use of this document by the reader. A professional advisor should be consulted regarding your specific situation. Information presented is believed to be factual and up-to-date but we do not guarantee its accuracy and it should not be regarded as a complete analysis of the subjects discussed. All expressions of opinion reflect the judgment of the authors as of the date of publication and are subject to change. No endorsement of any third parties or their advice, opinions, information, products or services is expressly given or implied by Royal Bank of Canada or any of its affiliates.
This document may contain forward-looking statements within the meaning of certain securities laws, which are subject to RBC’s caution regarding forward-looking statements. ESG (including climate) metrics, data and other information contained on this website are or may be based on assumptions, estimates and judgements. For cautionary statements relating to the information on this website, refer to the “Caution regarding forward-looking statements” and the “Important notice regarding this document” sections in our latest climate report or sustainability report, available at: https://www.rbc.com/community-social-impact/reporting-performance/index.html. Except as required by law, none of RBC nor any of its affiliates undertake to update any information in this document.
