
Recent geopolitical developments in the Middle East will leave February inflation unaffected but will push gasoline prices higher in March. And higher oil prices, if sustained, would impact our headline inflation forecast for the year. If WTI settles close to $75/barrel, we would expect headline inflation to surpass 3% by Q2. A sustained $100/barrel reality would keep headline above 3% through 2026, by our calculation. Higher energy prices will also have ramifications for retail sales in March. Squeezed consumers facing higher costs will have less room for discretionary spending, which would ultimately weigh on real retail sales even if prices support nominal metrics.
We expect next week’s data release will continue to highlight the widening gap between CPI and PCE – an unusual theme that only occurs about 20% of the time. We’re concerned that data quirks surrounding missing shelter data for CPI following the government shutdown could be artificially depressing CPI relative to PCE. While we favor the PCE measure, January PCE data is stale which means that the mid-week CPI release will probably draw more market attention. We forecast both headline and core CPI will rise +0.3% m/m in February, with year-over-year levels remaining stable.
Importantly, the recent consecutive months of elevated PPI prints warrant attention. January’s core PPI jumped +0.8% m/m following a December upside of +0.6% m/m. In both months, wholesale margins drove most of the gains – signs that tariff pressure is getting closer to impacting consumer prices because wholesalers are passing off higher costs to retailers to preserve their profit margins. These PPI increases will filter through to the CPI data with a lag, and we expect that we’re in the early stages of transmission. We project core PCE will tick higher in January +0.4% m/m, leaving the year-over-year measure unchanged at +3.0% and maintaining the 0.5 percentage point differential between core PCE and CPI. January’s PPI strength should not translate to higher PCE since the components most relevant for PCE – medical care services and domestic air transportation – didn’t post strong numbers.
On March 4th, a federal trade court order required the Administration to refund over $130 billion in global tariffs to importers, since IEEPA was invalidated by SCOTUS. But we expect this will translate to limited inflation relief. While duties are paid by importers and producers, firms who faced higher costs are unlikely to reverse price hikes already implemented. The distribution mechanism for these refunds also remains unclear. Importantly, the Supreme Court’s ruling does not eliminate tariff risk – the Administration has multiple pathways forward. With Section 122 tariffs locked in for 150 days, we expect continued tariff passthrough.
Aside from inflation data, here’s what else we’re watching next week:
-
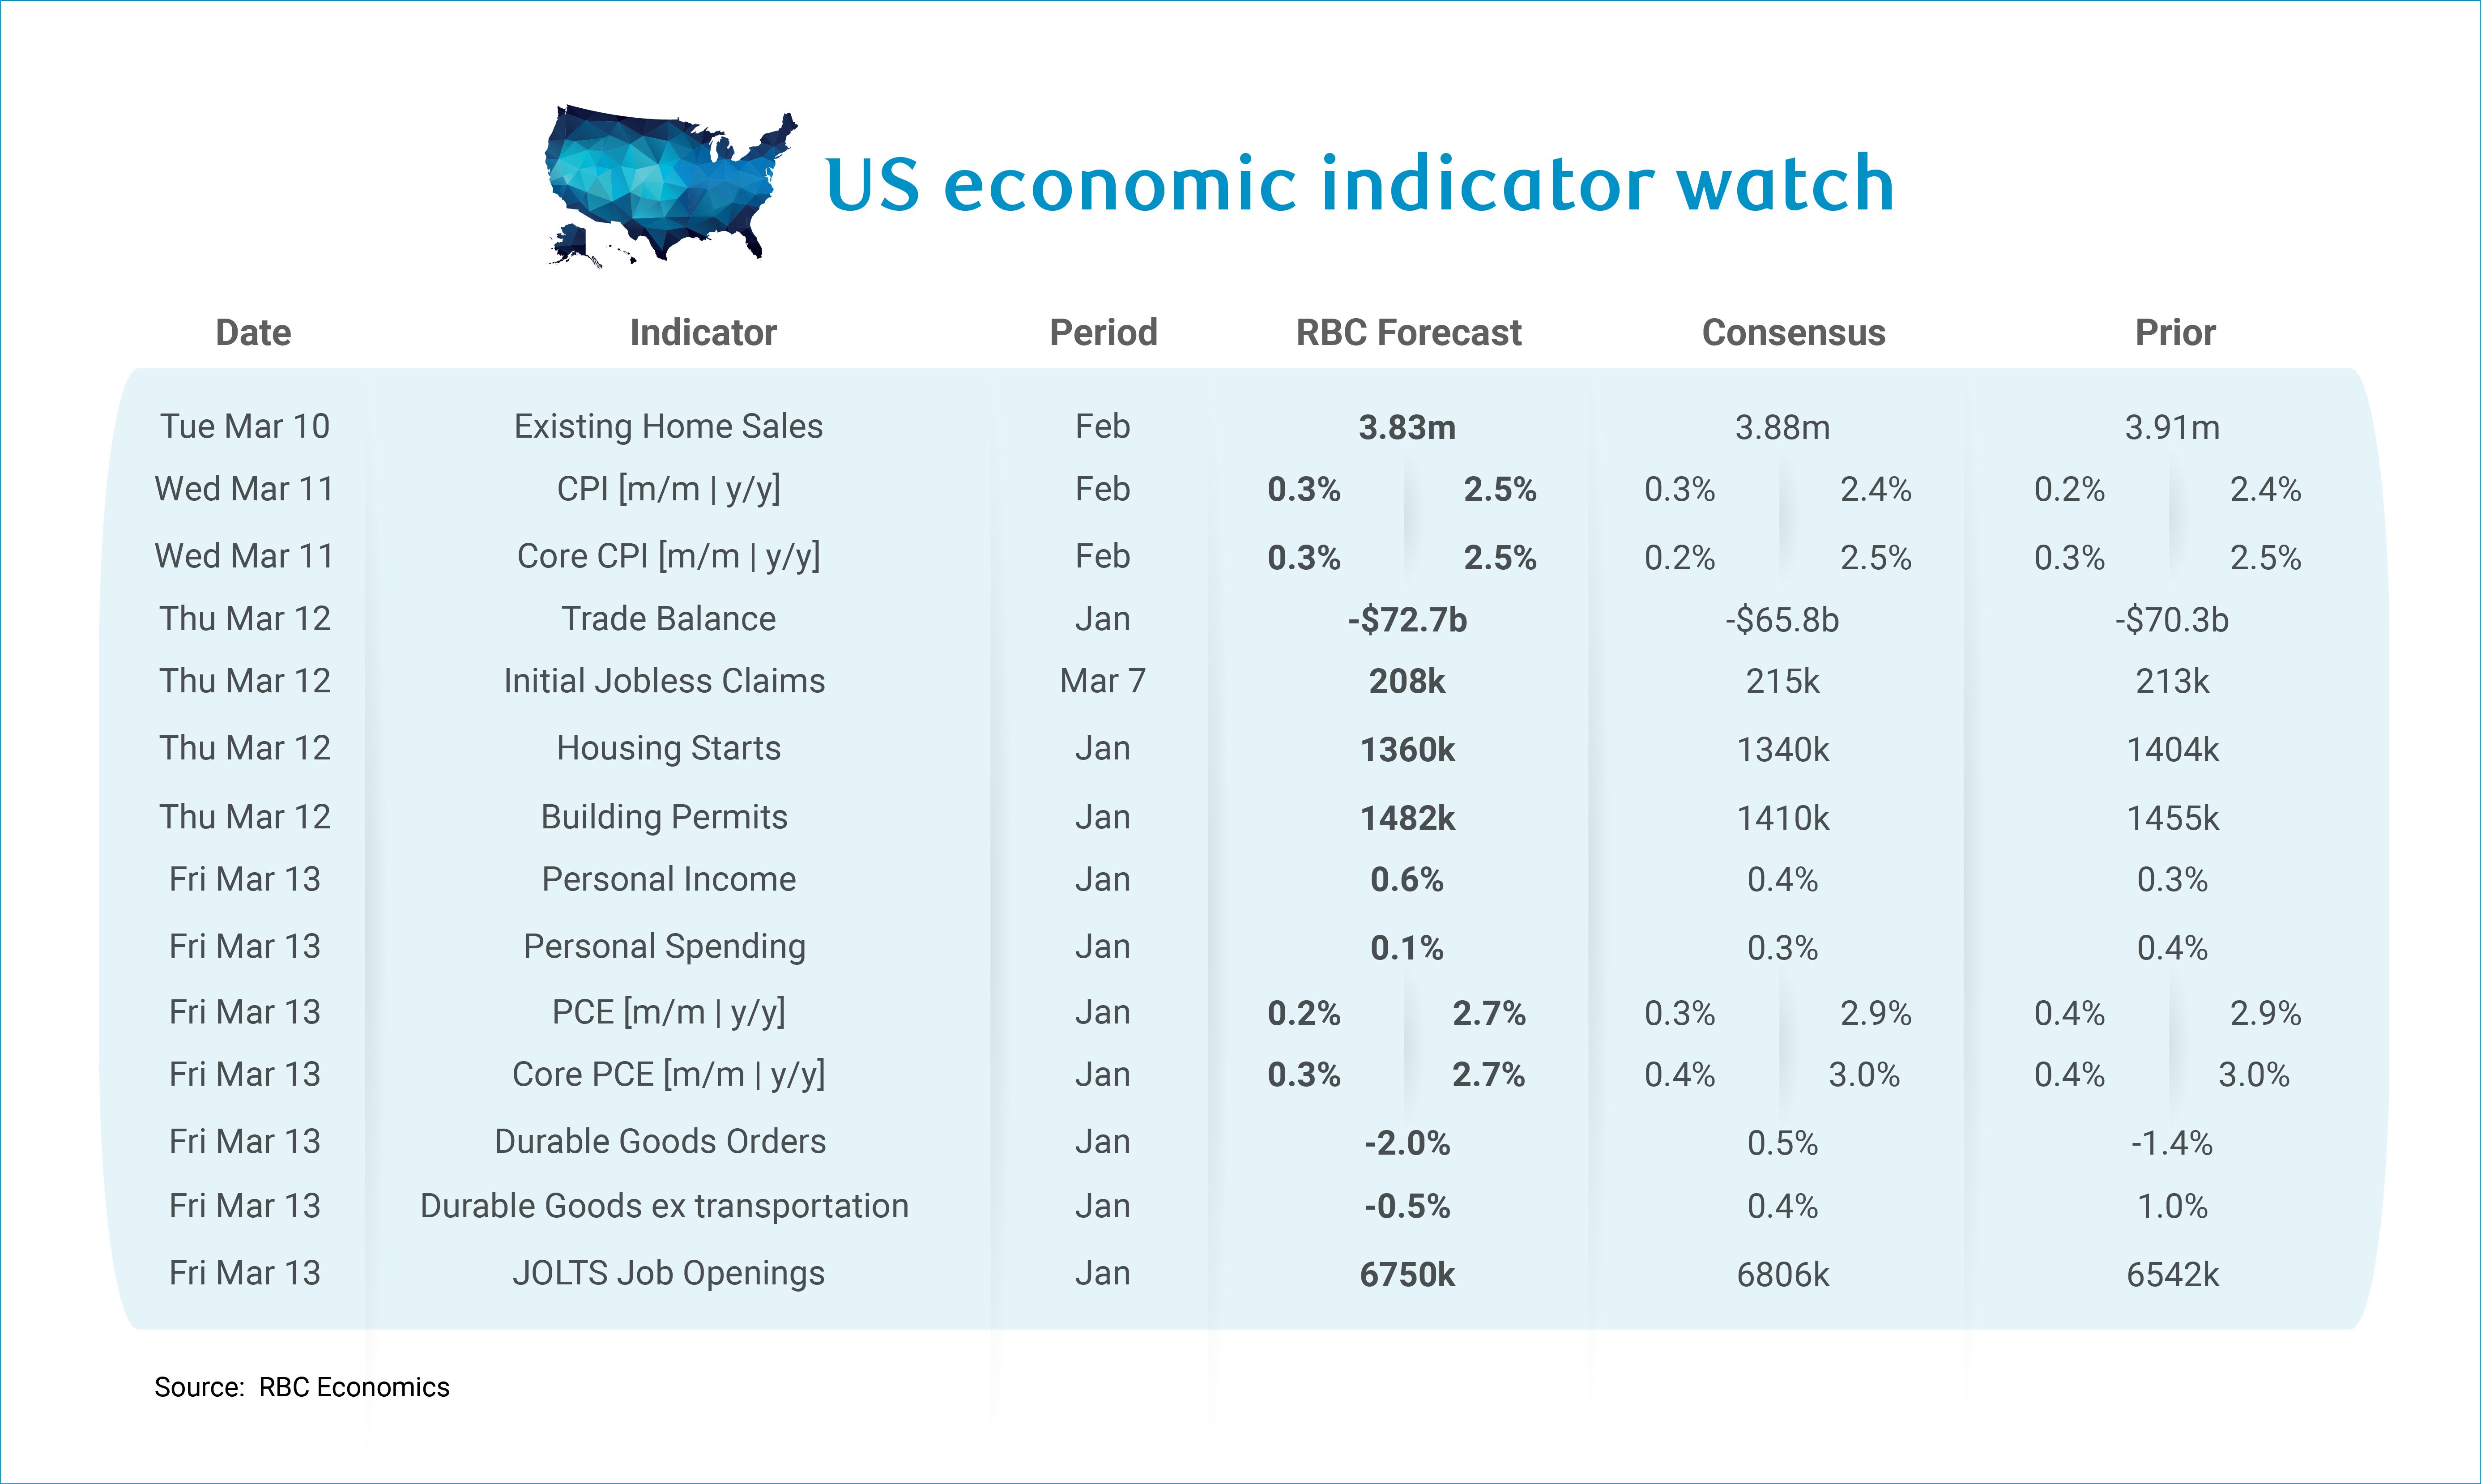
We expect to see that personal income rose +0.6% m/m in January. We typically see stronger growth in wages and salaries at the front of the year, reflective of year-end pay adjustments coming to fruition. Several states hiked minimum wage in January and COLA adjustments will boost income for social security recipients to the tune of 2.7%.
-
We are forecasting a +0.1% m/m increase in personal spending in January. Headline retail sales were lackluster in January and weaker restaurant spending may signal weaker appetite for discretionary services.
-
We expect to see initial jobless claims came in a weaker 208k as we have seen claims settle at persistently low levels in recent months. The February uptick in the unemployment rate (to 4.4%) was largely expected since continuing claims bottomed out during the January reference week. But our core view that the labor market is stabilizing amidst a low-firing, low job creation backdrop prevails.
-
We expect to see the trade balance widen to -$72.7 billion, notably as we see continued demand for industrial goods supporting AI infrastructure expansion. While IEEPA was overturned, we do not expect this to impact any data until February at the earliest.
-
Durable goods orders will likely land on the weaker side for January, -2.0% m/m, though this is largely a transportation sector story. Boeing orders continued to moderate in January after a November surge. Excluding the more volatile transportation sector, we have durables -0.5% m/m.
-
JOLTS job openings data for January is stale, but we expect to see an uptick in job openings after the surge in hiring highlighted in January’s NFP. February’s NFP reversal highlights that January’s surge was not sustainable and that hiring remains a structural story this year.
-
We are slated to get quite a bit of housing data next week (existing home sales, housing starts and building permits) and expect that the data will be lackluster. February existing home sales likely slid to an underwhelming 3.83 million and weaker expected January housing starts do not paint a particularly rosy picture. Building permits are expected to tick up slightly.
About the Authors
Mike Reid is Head of U.S. Economics at RBC. He is responsible for generating RBC’s U.S. economic outlook, providing commentary on macro indicators, and producing written analysis around the economic backdrop.
Carrie Freestone is a Senior US Economist at RBC Capital Markets. Carrie is responsible for projecting key US indicators including GDP, employment, consumer spending and inflation for the US. She also contributes to commentary surrounding the US economic backdrop which she delivers to clients through publications, presentations, and the media.
Imri Haggin is an Economist at RBC Capital Markets, where he focuses on thematic research. His prior work has centered on consumer credit dynamics and treasury modeling, with an emphasis on leveraging data to understand behavior.
This article is intended as general information only and is not to be relied upon as constituting legal, financial or other professional advice. The reader is solely liable for any use of the information contained in this document and Royal Bank of Canada (“RBC”) nor any of its affiliates nor any of their respective directors, officers, employees or agents shall be held responsible for any direct or indirect damages arising from the use of this document by the reader. A professional advisor should be consulted regarding your specific situation. Information presented is believed to be factual and up-to-date but we do not guarantee its accuracy and it should not be regarded as a complete analysis of the subjects discussed. All expressions of opinion reflect the judgment of the authors as of the date of publication and are subject to change. No endorsement of any third parties or their advice, opinions, information, products or services is expressly given or implied by Royal Bank of Canada or any of its affiliates.
This document may contain forward-looking statements within the meaning of certain securities laws, which are subject to RBC’s caution regarding forward-looking statements. ESG (including climate) metrics, data and other information contained on this website are or may be based on assumptions, estimates and judgements. For cautionary statements relating to the information on this website, refer to the “Caution regarding forward-looking statements” and the “Important notice regarding this document” sections in our latest climate report or sustainability report, available at: https://www.rbc.com/community-social-impact/reporting-performance/index.html. Except as required by law, none of RBC nor any of its affiliates undertake to update any information in this document.
