

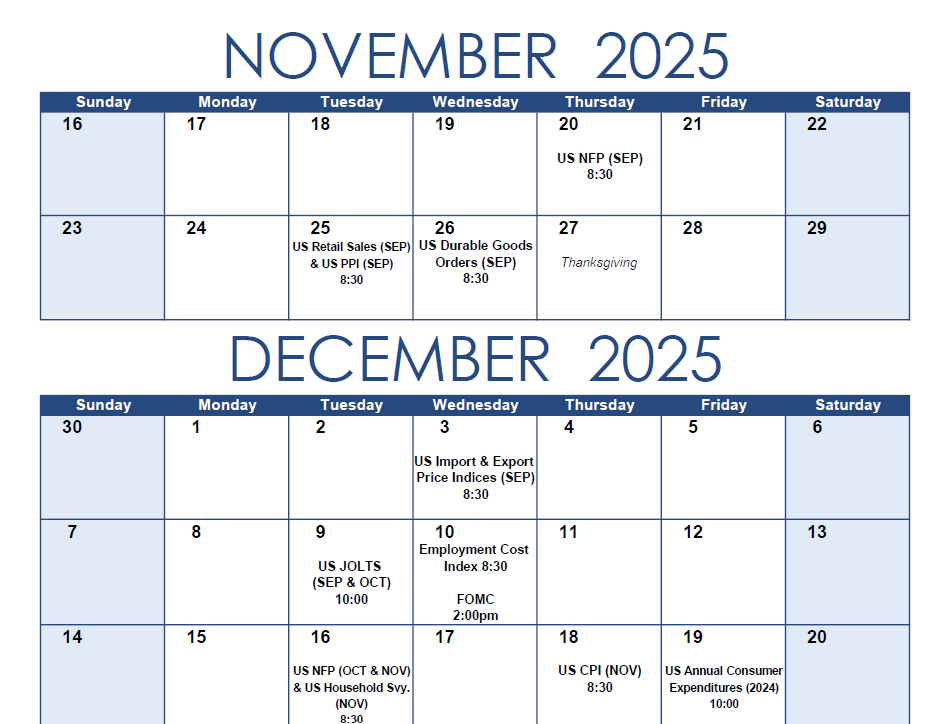
We’re one week into the reopening of the federal government and while we have more clarity on upcoming data releases, the state of the US economy itself remains murky. September’s employment report – which saw the unemployment rate tick up despite a strong payroll gain – provided little insight on the trajectory of the labor market. This will be problematic for the Fed as October and November employment data will not be released until after their December meeting, leaving them to make a decision with stale information.
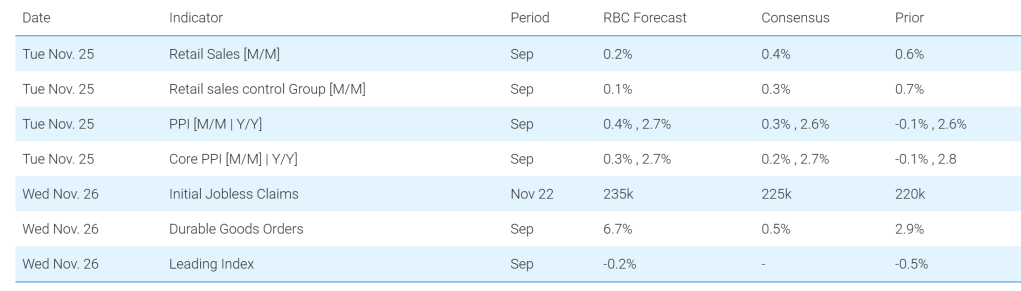
Next week is light on data in a holiday shortened week, however, we will learn about the health of the US consumer via September retail sales data on Tuesday. We expect it to show that spending growth cooled (+0.2% m/m), specifically for discretionary purchases. Since April, motor vehicles and auto parts have seen strong sales, growing at a >5% y/y pace alongside furniture sales suggesting consumers prioritized front-loading their spending ahead of tariffs. Nonstore retailers (i.e., primarily online merchants) continue to outpace traditional channels, and are up 10% y/y. But with wage growth slowing and tariffs now fully in place, we think higher prices will start weigh on consumption.
We also get PPI data, which feeds into the Fed’s preferred PCE deflators. While September’s CPI surprised to the downside, much of that stemmed from owners’ equivalent rent—which carries greater weight in CPI than in PCE. With that in mind, we will be watching the health care PPI measures which will be important for PCE inflation. We’re forecasting PPI at +0.4% m/m, with prices for goods and food products likely to outpace services as tariff pressures persist. The Fed will not get inflation data beyond September ahead of the December meeting. The BLS announced October CPI data will NOT be released, after price data was unable to be collected during the month of October.
Unfortunately for the Fed, the timelier data will come after the December meeting. We continue to get updates on data release and have included a calendar below with revised data releases based on official announcements from statistical agencies. Both October and November nonfarm payrolls are scheduled for release on December 16th. The household survey for October, on the other hand, will not be released, so we will have a gap in the unemployment data. We also plan to watch the delayed Annual Consumer Expenditures report (now published December 19th), which determines CPI weights. Any notable shift from services to goods spending in the CEX could nudge 2026 CPI forecasts higher given the tariff pressures.
We also have the following releases next week:
-
Initial jobless claims are expected to rise to 235k in the week ending November 22nd. This uptick can be attributed to where we are in the calendar rather than a weakening of the labor market. In fact, backdated October initial claims data suggests that the labor market stabilized in the fall months. The Conference Board’s labor market differential (LMD) – which measures the difference between the share of consumers surveyed who say jobs are “plentiful” and the share who say that jobs are “hard to get” – suggests that October improved slightly.
-
We also get the Conference Board’s Consumer Confidence measure for November. In October, confidence appeared to stabilize after deteriorating notably in September. This year has been marked by divergent themes – consumer confidence is eroding while the hard data remains stable. This is symbolic of the K-Shape economy at work. Economists can no longer rely on the “soft” data as a leading indicator.
-
We also get the Conference Board’s Composite Index of Leading Indicators (LEI) on Wednesday, but since this indicator contains a mix of hard and soft data, we find it less useful in the context of the current backdrop.
-
Durable goods orders likely rose by +6.7% m/m in the month of September, but the majority of this can be attributed to a monthly uptick in Boeing orders, which nearly tripled in September relative to August.
About the Authors
Mike Reid is a Senior U.S. Economist at RBC. He is responsible for generating RBC’s U.S. economic outlook, providing commentary on macro indicators, and producing written analysis around the economic backdrop.
Carrie Freestone is an economist and a member of the macroeconomic analysis group. She is responsible for examining key economic trends including consumer spending, labour markets, GDP, and inflation.
Imri Haggin is an economist at RBC Capital Markets, where he focuses on thematic research. His prior work has centered on consumer credit dynamics and treasury modeling, with an emphasis on leveraging data to understand behavior.
This article is intended as general information only and is not to be relied upon as constituting legal, financial or other professional advice. The reader is solely liable for any use of the information contained in this document and Royal Bank of Canada (“RBC”) nor any of its affiliates nor any of their respective directors, officers, employees or agents shall be held responsible for any direct or indirect damages arising from the use of this document by the reader. A professional advisor should be consulted regarding your specific situation. Information presented is believed to be factual and up-to-date but we do not guarantee its accuracy and it should not be regarded as a complete analysis of the subjects discussed. All expressions of opinion reflect the judgment of the authors as of the date of publication and are subject to change. No endorsement of any third parties or their advice, opinions, information, products or services is expressly given or implied by Royal Bank of Canada or any of its affiliates.
This document may contain forward-looking statements within the meaning of certain securities laws, which are subject to RBC’s caution regarding forward-looking statements. ESG (including climate) metrics, data and other information contained on this website are or may be based on assumptions, estimates and judgements. For cautionary statements relating to the information on this website, refer to the “Caution regarding forward-looking statements” and the “Important notice regarding this document” sections in our latest climate report or sustainability report, available at: https://www.rbc.com/community-social-impact/reporting-performance/index.html. Except as required by law, none of RBC nor any of its affiliates undertake to update any information in this document.
