
It’s been just over one year since Liberation Day—when the US administration announced sweeping tariffs on all trade partners to reduce imbalances—but trade deficit hasn’t narrowed while trade has been diverted.
At present, all eyes are focused on a new shock: The conflict in the Middle East, which has sent oil prices soaring to near-2022 highs when Russia invaded Ukraine. Still, beneath the surface, the ramifications of tariffs are building, and spiking oil prices will add to pre-existing tariff price pressures with both core and headline inflation rising in tandem.
One year out, here’s how we’re reflecting on the trade disruption.
Map redrawn: Trade diversion and a deficit that didn’t narrow
Tariffs were designed primarily to reduce imbalances, particularly with China, and secondarily, to reduce the overall deficit.
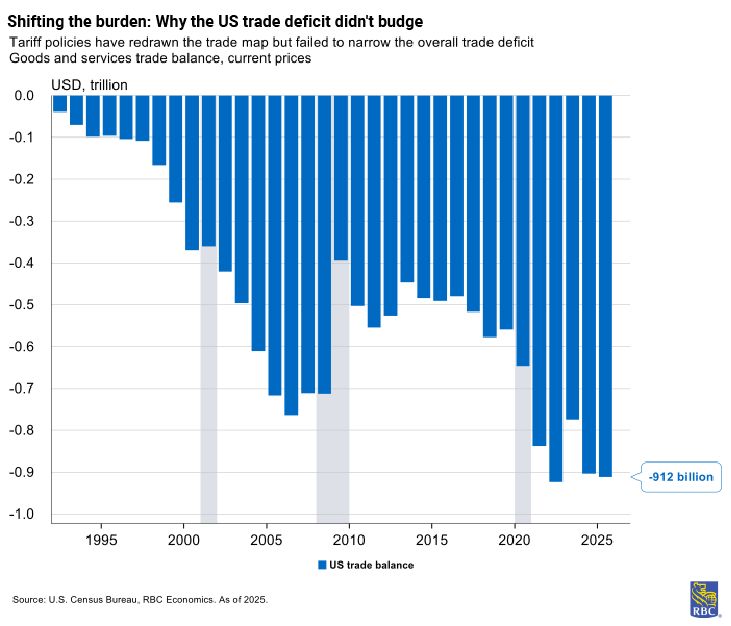
However, data indicates neither objective has been meaningfully achieved so far. The overall goods and services deficit widened by $8 billion in 2025 compared to 2024, a negligible shift that, nonetheless, moved in the wrong direction.
The goods deficit widened by $25.5 billion over the same horizon, and the relative difference came entirely from a widening services surplus, typical for the current nature of the American economy.
The US reported a record $1.23 trillion goods trade deficit in 2025. The structural explanation is straightforward: Tariffs successfully reduced imports from primary targets (especially China), but import demand was irreplaceable, and buyers redirected sourcing elsewhere, leaving the aggregate measure unchanged.
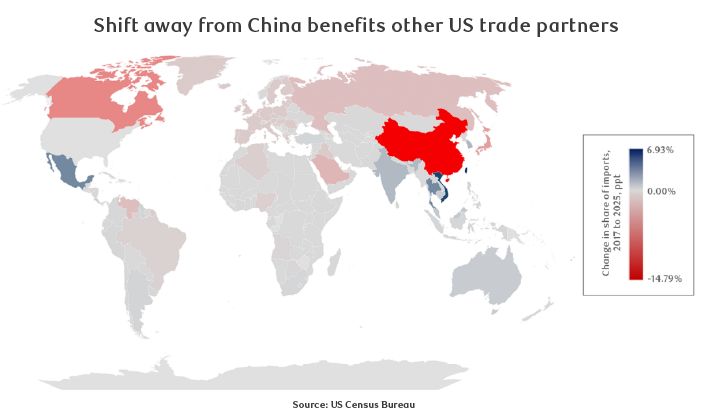
China is the clearest example of this. The US-China goods deficit narrowed by almost a third to $202 billion in 2025, a reduction in US imports from China of 28%. As a result, China now accounts for 9% of US goods imports compared to just over 13% in 2024.
The winners are clearly legible in Bureau of Economic Analysis (BEA) data. Vietnam’s deficit widened by $54.7 billion to $178.2 billion. Thailand (widened by $71.9 billion), India ($58.2 billion), and Malaysia ($30.8 billion) also expanded materially. The deficit with Mexico also grew significantly by $25 billion to $196 billion despite being subject to 25-35% tariffs at various points throughout the year (albeit with significant USMCA exemptions), reflecting its depth of integration into US manufacturing supply chains.
At the same time, the deficit with Taiwan almost doubled, rising $73 billion to $146.8 billion. Taiwan’s near exclusive role as an advanced semiconductor producer likely made it the primary routing point for key inputs for the data center boom in the US.
An interesting flip side to reduced US imports from China is the redirection of exports elsewhere. Exports to ASEAN countries rose, and China’s reported trade balance reached $1.19 trillion, exceeding the prior year by 20%. Ultimately, geography shifted substantially, but aggregate scale did not.
The trade landscape has drastically shifted
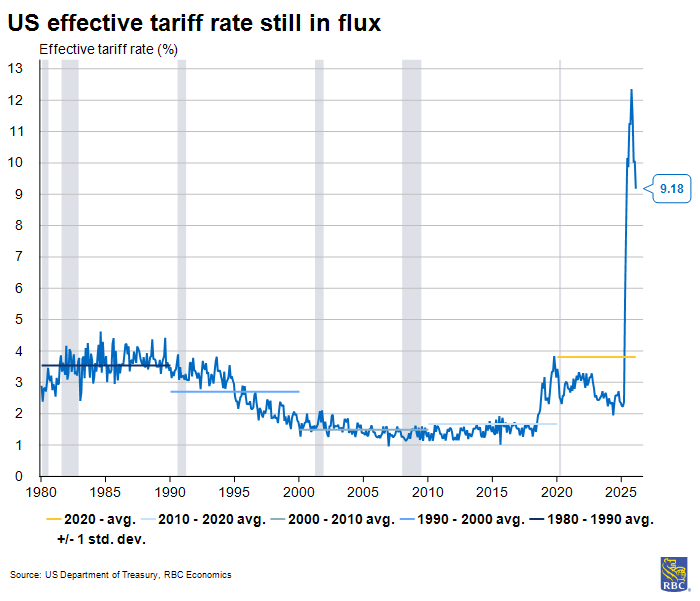
Liberation Day ushered in a new trade regime. President Trump signed Executive Order 14257 on April 2, 2025, declaring the US goods trade as a national emergency, invoking IEEPA to authorize sweeping “reciprocal” tariffs on nearly all trading partners.
The system introduced a baseline 10% levy to roughly 180 countries with higher country-specific rates. Section 232 auto tariffs of 25% also took effect on April 3, and pre-existing steel and aluminum tariffs were raised to 50% in June 2025.
Following these tariff announcements, bilateral framework agreements were reached with trading partners reducing Liberation Day tariff rates in several countries.
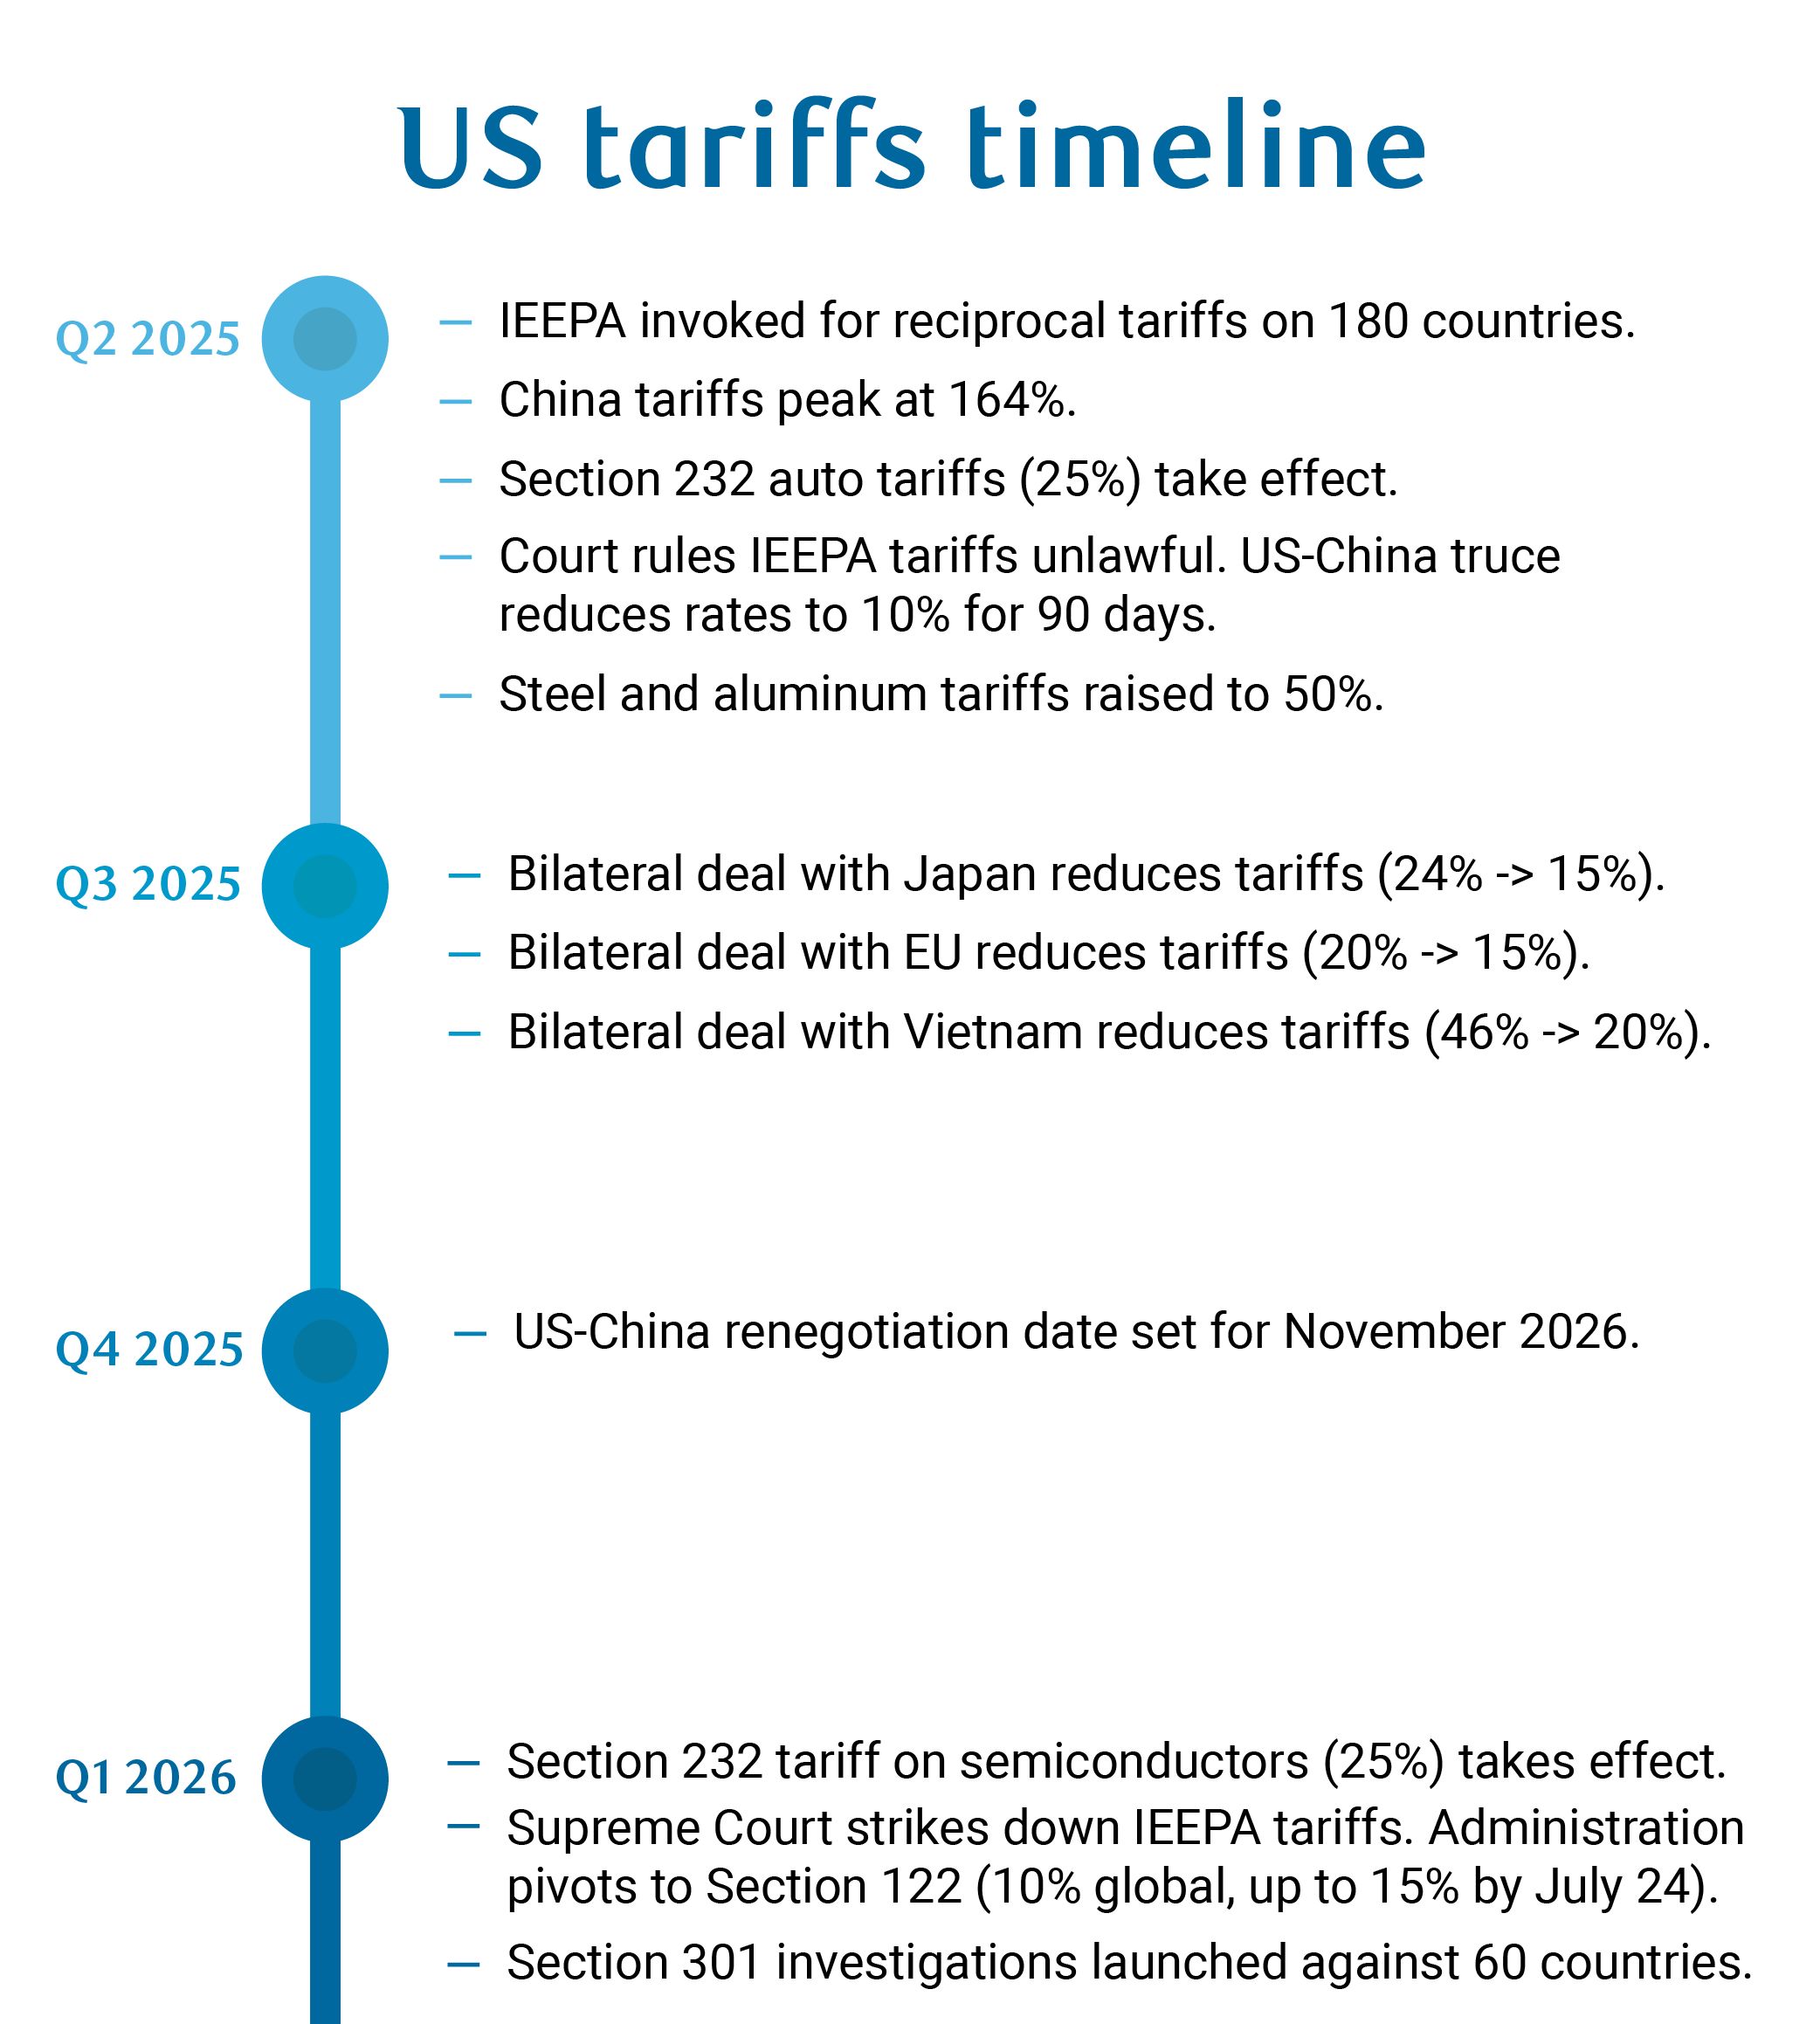
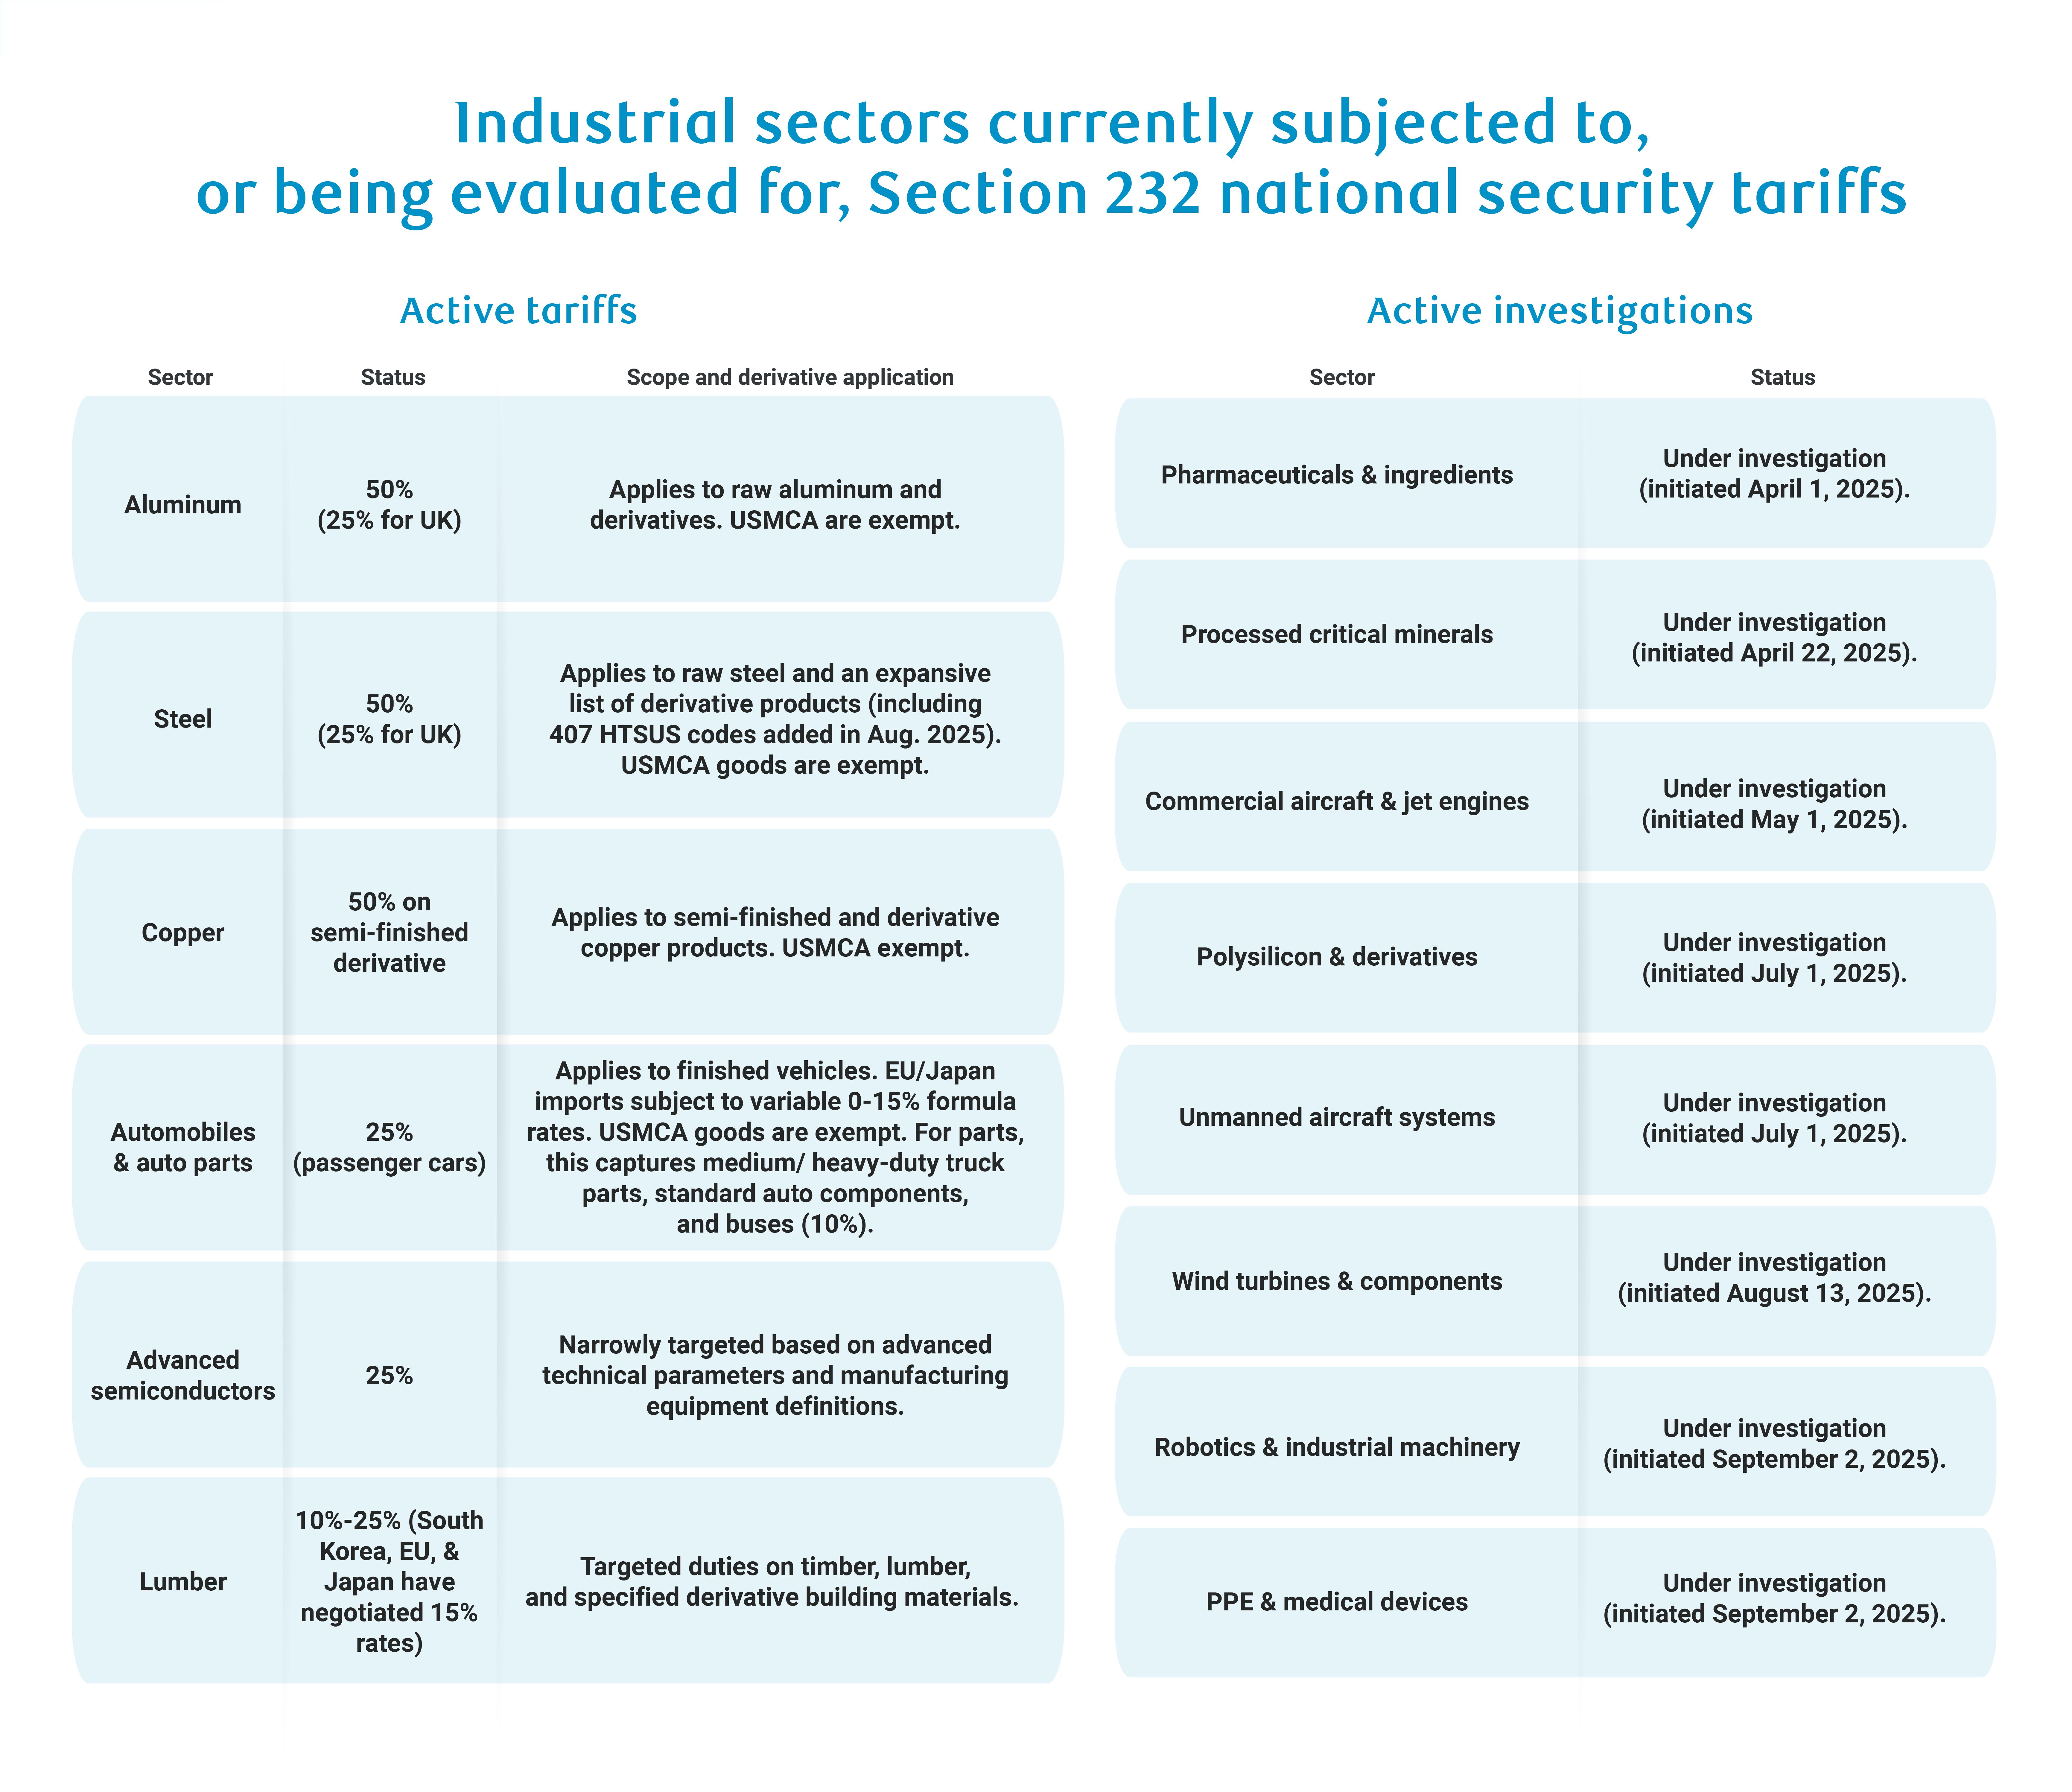
There are currently seven Section 232 tariff orders in effect—steel (50%), aluminum (50%), autos and auto parts (25%), copper, timber and lumber, medium and heavy-duty trucks. And, since Jan. 15 2026, tariffs on certain advanced semiconductors and semiconductor manufacturing equipment (25%). Pending investigations could produce additional tariffs on pharmaceuticals and pharmaceutical ingredients, processed critical minerals, commercial aircraft and aerospace components, drones, wind turbines, robotics and industrial machinery, and medical equipment.
The emerging post-IEEPA tariff structure can be best summarized as follows: Section 122 as a short-term bridge, Section 232 as the principal sector-based tool, and Section 301 as the country and policy-based tool (alleging country and policy trade).
What the trade shift has meant for prices
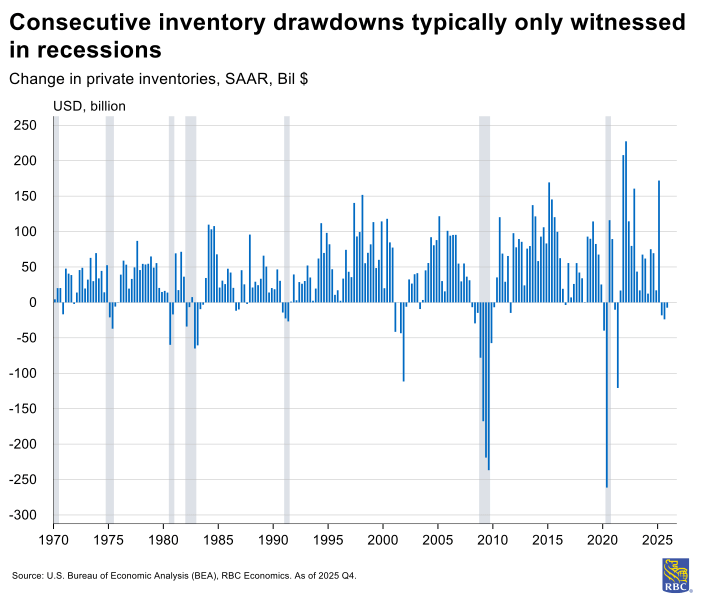
In early 2025, as firms reacted to tariff announcements, imports soared, and inventories reported their highest quarterly accumulation on record outside of COVID distortions (dating back to the late 1940s).
Firms strategically accumulated a backstock of critical inputs and product at pre-tariff prices, which delayed the full tariff passthrough. Businesses were able to tap into these pre-tariff inventories to help buffer profit margins without raising prices proportionately to the tariffs.
We also suspect a good chunk of imports was loaded into bonded warehouses, and are not yet subject to duties since they are paid once product is available for domestic consumption (i.e., once the goods “cross” the US border).
Inventory drawdown has helped delay tariff passthrough, but that strategy is winding down. (Read more on how inventories are measured) Three consecutive months of Producer Price Index (PPI) spikes driven by trade-exposed sectors, specifically, trade services and transportation and warehousing serve as strong evidence.
Trade services PPI is unique in that it reflects margins—the difference between selling price of a product by wholesalers and the price paid to acquire the good. Spikes in trade services PPI suggests firms are beginning to charge retailers more to acquire goods relative to the cost of acquisition. We view this as a signal that a rise in consumer prices will soon follow.
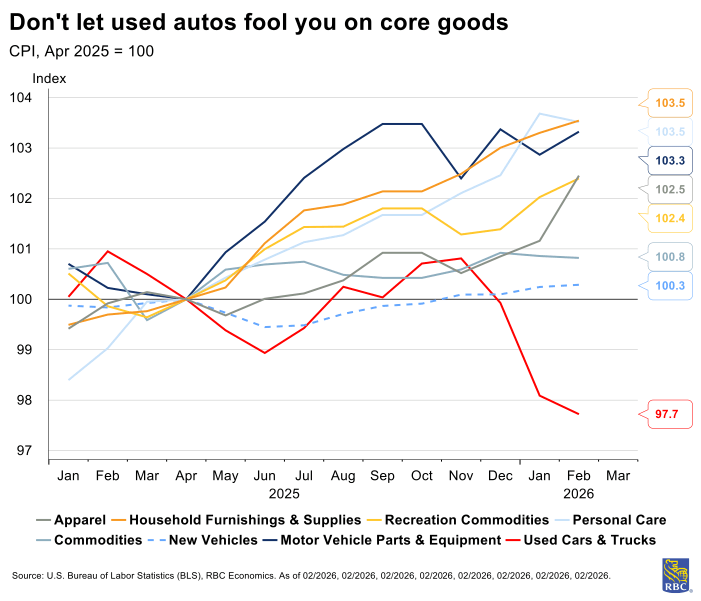
And indeed, beneath the surface, we have witnessed consumer price pressures building, though downward pressure in used auto prices (a sector not subject to tariffs) is skewing the overall core goods inflation metric lower than it would otherwise be.
Stripping out used cars and trucks, prices have risen in a few notable trade-exposed sectors including motor vehicle parts and equipment, household furnishing and supplies, personal care, recreation commodities, and most-recently, a spike in apparel suggesting pre-tariff inventories have been largely used up.
Tariff revenue is not a solution for the budget deficit
The Administration has framed tariff revenue as a solution for the budget deficit, but there are a few reasons why we don’t view tariffs as a sustainable solution:
-
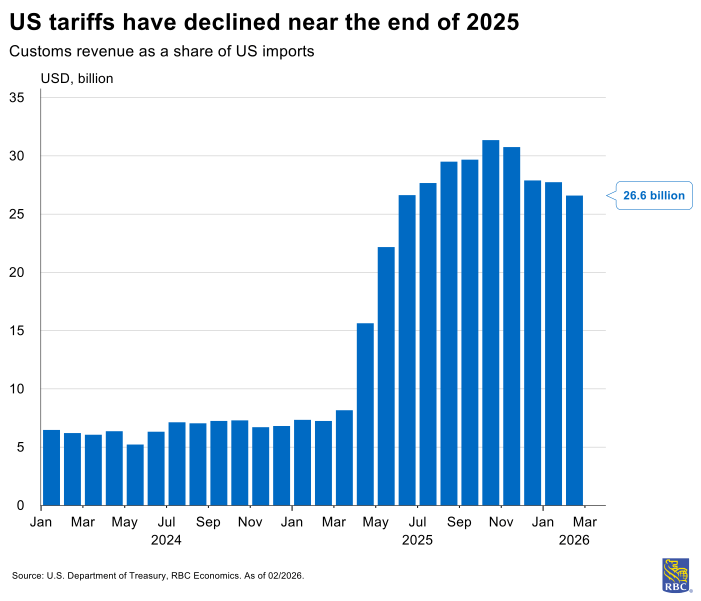
The numbers are of the wrong scale. The record $264 billion of customs duties collected in fiscal year 2025 sounds large in isolation. Against the FY2025 federal deficit of $1.8 trillion, this amounts to 14 cents per dollar of indebtedness, which, in our view, is directionally helpful, but fundamentally and structurally insufficient.
The Congressional Budget Office’s (CBO) baseline estimate in February showed that higher tariffs reduce cumulative deficits by $3 trillion over 2026–2035 (based on assumption that IEEPA era policies continued permanently without changes). But, as we discussed previously, the One Big Beautiful Bill Act (OBBBA of July 2025, budget reconciliation) alone increases the deficit by more than this ($4.7 trillion) over the same period.
Tariffs do not generate enough revenue for these tax cuts. They cover roughly 60 cents of every dollar on net that tax cuts add to the bill. Deficits from 2026 to 2035 are projected to total $23.1 trillion, which is $1.4 trillion more than the CBO projected pre-tariff and OBBBA. -
The revenue is self-defeating, by design. A tariff that works (reduces imports), aside from destroying consumer surplus, shrinks its own generation base. The CBO explicitly projects that customs duty receipts will decline as imports as a percentage of GDP falls in response to tariffs even as other revenue sources rise.
The mechanism is baked in: The more successfully tariffs redirect sourcing and compress import volumes, the less revenue they generate.
-
The IEEPA ruling has made the fiscal plan significantly worse. As IEEPA tariffs have been struck down, much of the potential deficit improvement via tariffs fell with it. We are closely watching the implementation of alternate tariffs under Sections 122, 232, and 301 and their fiscal impact.
As of March 5, 2026, the CBO estimated that IEEPA’s termination increases projected deficits by $2 trillion over 2026–2036 if revenues aren’t replaced. IEEPA collections reached roughly $150 billion by mid-December 2025.
The administration’s position on automatic refunds remains unclear.
No evidence of reshoring and trade reliant sectors are shedding jobs
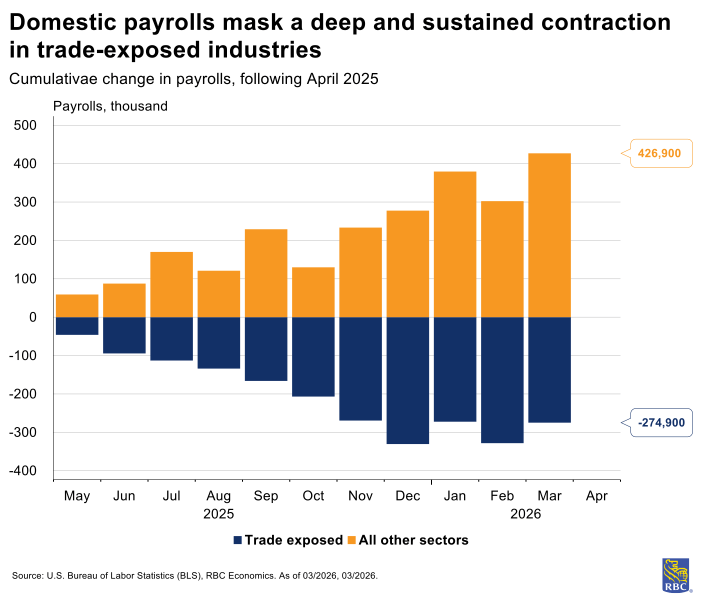
We have seen no evidence that re-shoring jobs is underway to date. In fact, the US manufacturing sector is continuing to lose jobs.
This is a decades-old story, and tariffs haven’t changed the narrative. Since Liberation Day, 275,000 jobs were shed in trade-exposed sectors including manufacturing, wholesale and retail trade, transportation and warehousing, and temporary help services. Meanwhile, nearly 430,000 jobs were added on net in all other sectors combined. Of all trade-exposed sectors, transportation and warehousing were hit the hardest with the magnitude of job losses—reminiscent of COVID era cuts.
Output isn’t ramping up significantly either. Manufacturers’ shipping data suggests shipments were up about 2% from Liberation Day as of January 2026 (and an even lower 1.7% excluding defense). This is nominal—after offsetting the impact of inflation, growth is negligible.
Even if demand was higher for products manufactured domestically, the US manufacturing sector is grappling with capacity constraints. Capacity utilization rates—the percentage of available resources (labor and capital) currently in use—suggest the difference between actual and potential output in manufacturing has moved little over the past year.
Currently, the manufacturing sector could produce about 25% more with current capital constraints, and this has been the case for quite some time. If reshoring were viable, it would require productivity enhancements in the sector, a massive pool of available labor (subject to current skills-matching and geographical constraints). Aside from the initial capital investment required to build additional manufacturing facilities, they would be an extensive drain on the US electrical grid at a time where data center usage is already a heavy user.
Tariffs will remain in play even with IEEPA overturned
As we have written before, the US Supreme Court ruling does not mean tariffs are going away. There are other avenues through which the current administration will pursue its trade agenda.
Section 232 tariffs, while limiting the ability to focus on country-specific trade imbalances, allow unlimited tariffs on imports threatening broadly defined “national security” and are already in use for a variety of industries like steel and aluminum. These tariffs could be expanded to include additional industries. Active investigations are required by the US Department of Commerce for a total of 270 days, and many are well underway for a variety of sectors from pharmaceuticals and critical minerals to wind turbines.
Section 201 tariffs are also industry specific, but viewed as a temporary safeguard. Both Sections 301 and 338, on the other hand, are country-specific tariffs with the former requiring a year-long investigation at minimum, and the latter the most flexible with limited procedural hurdles, but has not been used in decades.
The path forward
The tariff regime’s true impact on consumer prices remains obscured by inventory drawdowns and bonded warehouse stockpiles.
As firms deplete pre-tariff inventory buffers throughout the spring and summer, the full passthrough of tariff costs to consumers will likely become more visible in inflation data. We expect the trajectory to peak by mid-year, though the timing remains uncertain amidst IEEPA rulings and the oil price shock.
Complicating the picture further is the oil price shock. Tariff pressures and oil spikes are now compounding in tandem, creating a dual inflation headwind that monetary policy cannot address. The convergence of these two shocks—one structural and policy-driven, the other exogenous and geopolitical—creates a more challenging inflation environment than either alone.
Our base case forecast assumes core inflation peaks near 3% by mid-2026, a level that would test the Federal Reserve’s commitment to its 2% target, but remain manageable within current policy frameworks. Still, significant risks abound.
Ongoing legal battles surrounding tariff authority could produce unexpected outcomes that either accelerate or delay passthrough. And, further escalation in the Middle East could push oil prices higher still, adding another layer of upside pressure.
The interplay of legal uncertainty, sectoral tariff investigations, and geopolitical risk creates a wide range of possible outcomes for the US economy.
About the Authors:
Mike Reid is Head of US Economics at RBC. He is responsible for generating RBC’s US economic outlook, providing commentary on macro indicators, and producing written analysis around the economic backdrop.
Carrie Freestone is a Senior US Economist at RBC. Carrie is responsible for projecting key US indicators including GDP, employment, consumer spending and inflation for the US. She also contributes to commentary surrounding the US economic backdrop which she delivers to clients through publications, presentations, and the media.
Imri Haggin is an US Economist at RBC, where he focuses on thematic research. His prior work has centered on consumer credit dynamics and treasury modeling, with an emphasis on leveraging data to understand behavior.
This article is intended as general information only and is not to be relied upon as constituting legal, financial or other professional advice. The reader is solely liable for any use of the information contained in this document and Royal Bank of Canada (“RBC”) nor any of its affiliates nor any of their respective directors, officers, employees or agents shall be held responsible for any direct or indirect damages arising from the use of this document by the reader. A professional advisor should be consulted regarding your specific situation. Information presented is believed to be factual and up-to-date but we do not guarantee its accuracy and it should not be regarded as a complete analysis of the subjects discussed. All expressions of opinion reflect the judgment of the authors as of the date of publication and are subject to change. No endorsement of any third parties or their advice, opinions, information, products or services is expressly given or implied by Royal Bank of Canada or any of its affiliates.
This document may contain forward-looking statements within the meaning of certain securities laws, which are subject to RBC’s caution regarding forward-looking statements. ESG (including climate) metrics, data and other information contained on this website are or may be based on assumptions, estimates and judgements. For cautionary statements relating to the information on this website, refer to the “Caution regarding forward-looking statements” and the “Important notice regarding this document” sections in our latest climate report or sustainability report, available at: https://www.rbc.com/community-social-impact/reporting-performance/index.html. Except as required by law, none of RBC nor any of its affiliates undertake to update any information in this document.
Get the latest forecasts and analysis from RBC Economics.
Subscribe Now
- Map redrawn: Trade diversion and a deficit that didn’t narrow
- The trade landscape has drastically shifted
- What the trade shift has meant for prices
- Tariff revenue is not a solution for the budget deficit
- No evidence of reshoring and trade reliant sectors are shedding jobs
- Tariffs will remain in play even with IEEPA overturned
- The path forward