
As we approach the five-year mark of inflation running above the Federal Reserve’s 2% target, we remain concerned about the likelihood it remains stuck closer to 3% throughout 2026. The combination of a tight labor market, strong consumer spending, tariff pass through, and a lagged housing inflation measure is a recipe for sticky inflation.
Recent developments have suggested some moderation in the inflation profile—in particular—a slowdown in core services and motor vehicle prices. But we’re not convinced these deflationary trends will continue in the coming year.
That said, monitoring inflation is particularly challenging right now. Data distortions and disruptions, uncertain tariff policies, and structural shifts related to demographics are adding crosscurrents in inflation’s path, and our ability to read it.
The 2025 US federal government shutdown disrupted data collection—with monthly data largely missing for October and collected over a condensed window in November. Ongoing distortions complicate high conviction interpretation of month-over-month inflation prints.
Meanwhile, the Owners’ Equivalent of Rent (OER) component of the Consumer Price Index (CPI) continues to distort the picture, exerting outsized influence on the CPI basket, though its impact on the Fed’s preferred measure, core PCE, is more limited.
As we navigate these crosscurrents on inflation, here’s our guide on how to monitor inflation data in the months ahead.
Tariffs add to goods inflation but its path was already moving higher
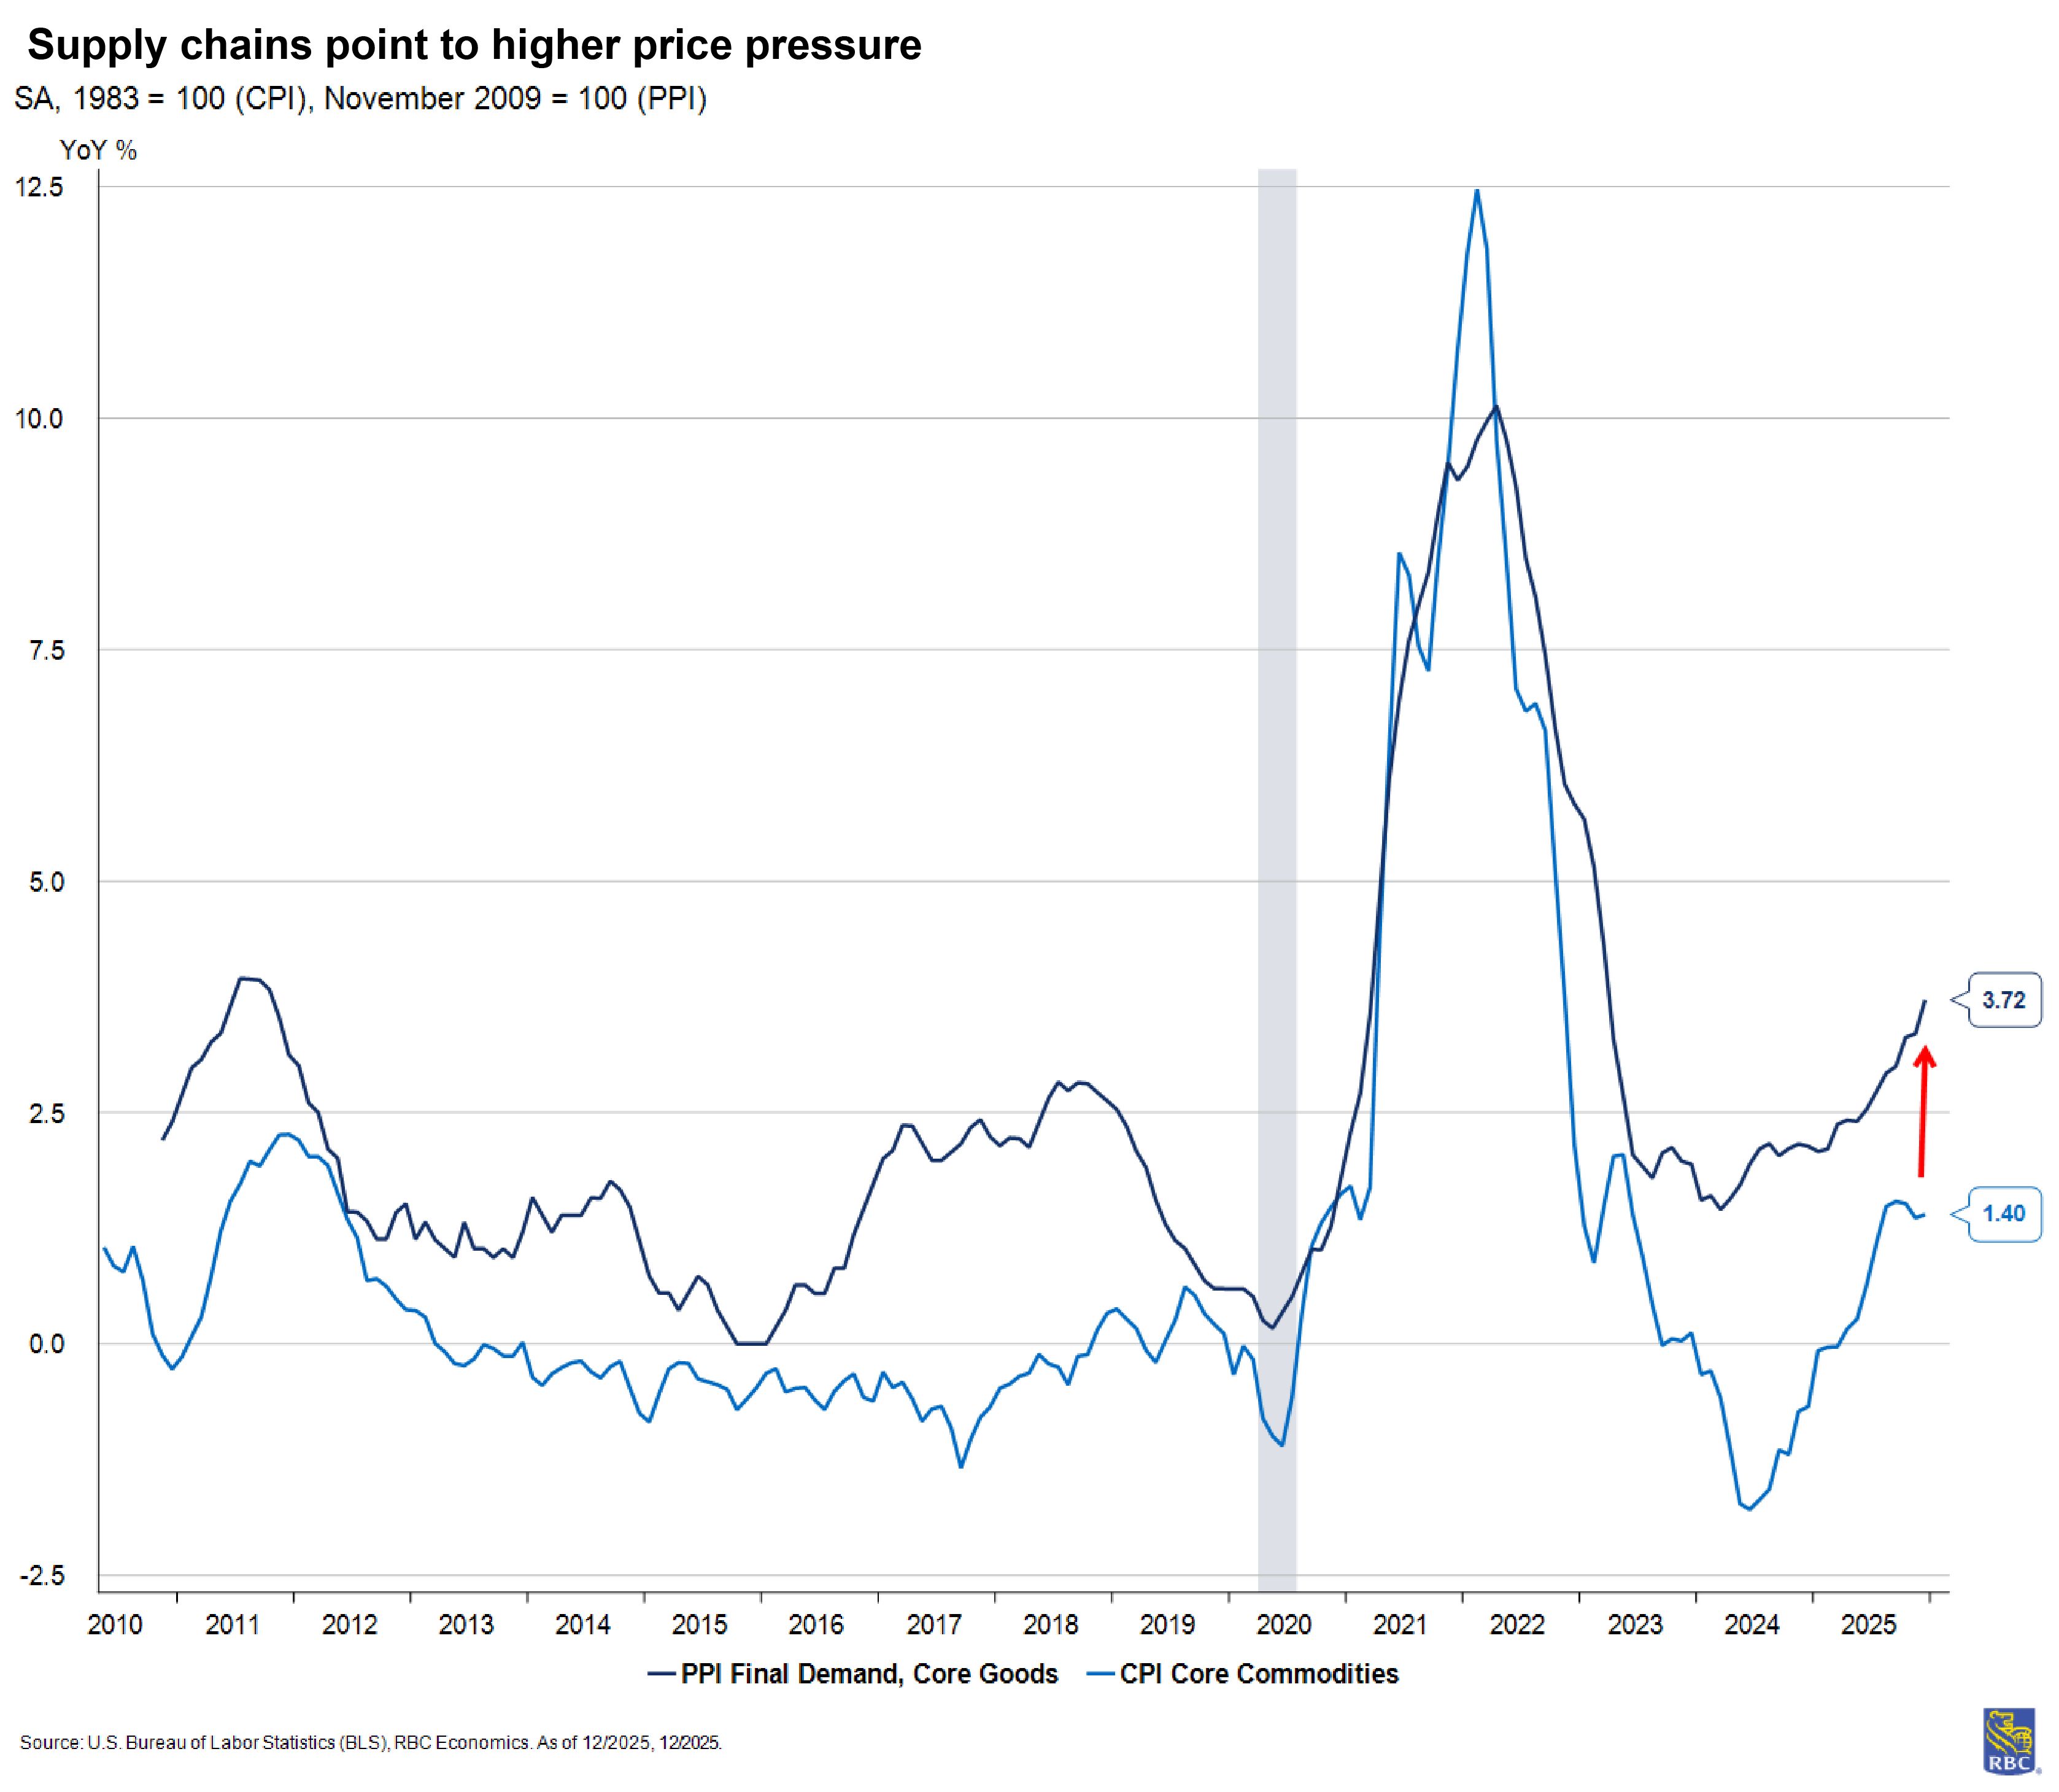
Core goods prices were already heading higher following a deflationary trend through most of 2024. As supply chains and demand normalized, there was a limited window for prices to fall meaningfully, and we had expected modest goods inflation in 2025 (i.e., below 1% y/y) before tariffs were introduced.
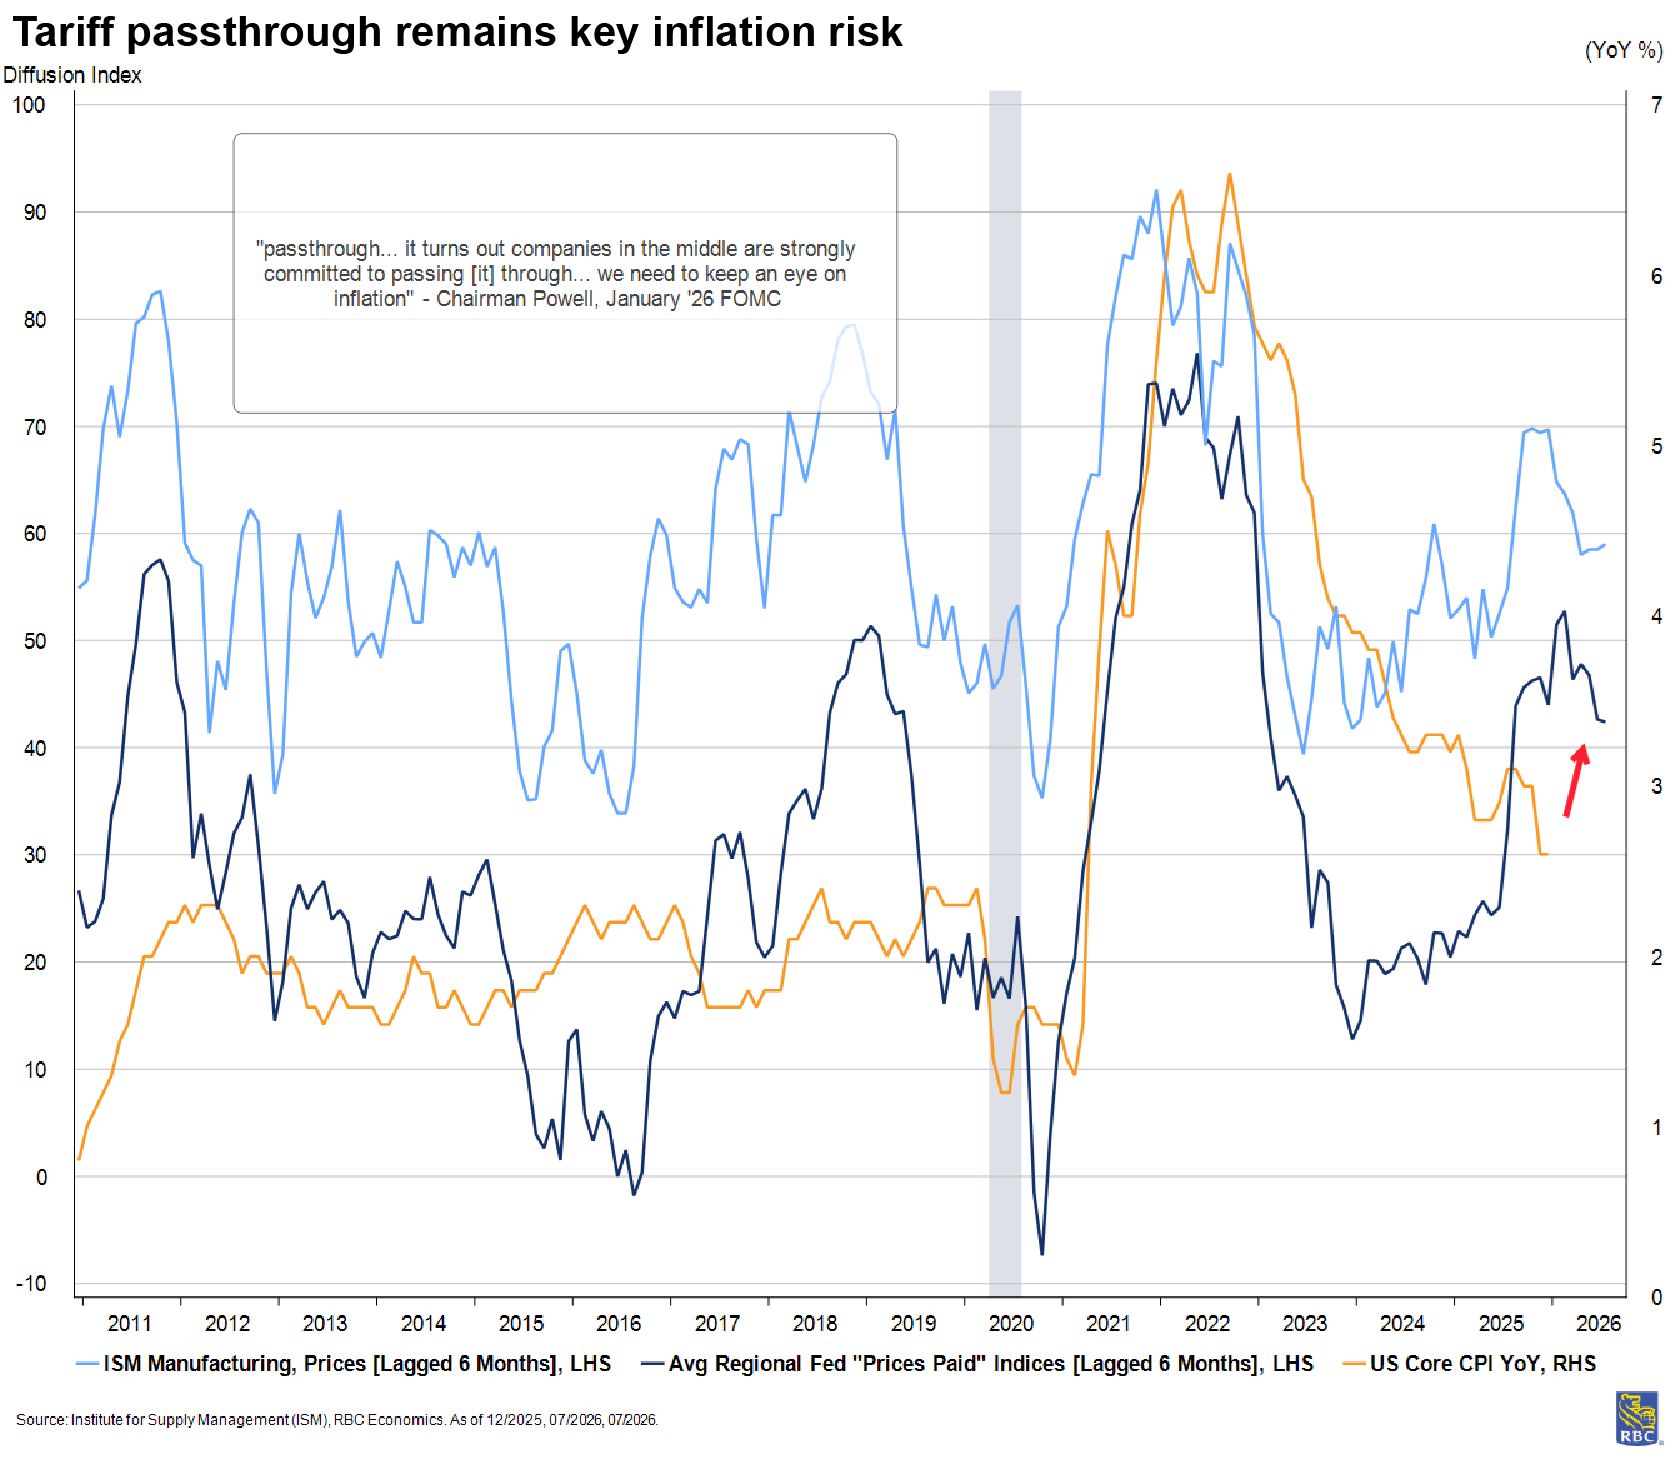
Adding tariffs to the mix, we estimate the contribution of core goods to core CPI added 0.3 percentage point to core CPI’s y/y pace in Q3, well above the pre-COVID norm. We remain concerned that we have yet to see the full passthrough of tariffs to consumer prices, which we think will peak in Q2 2026.
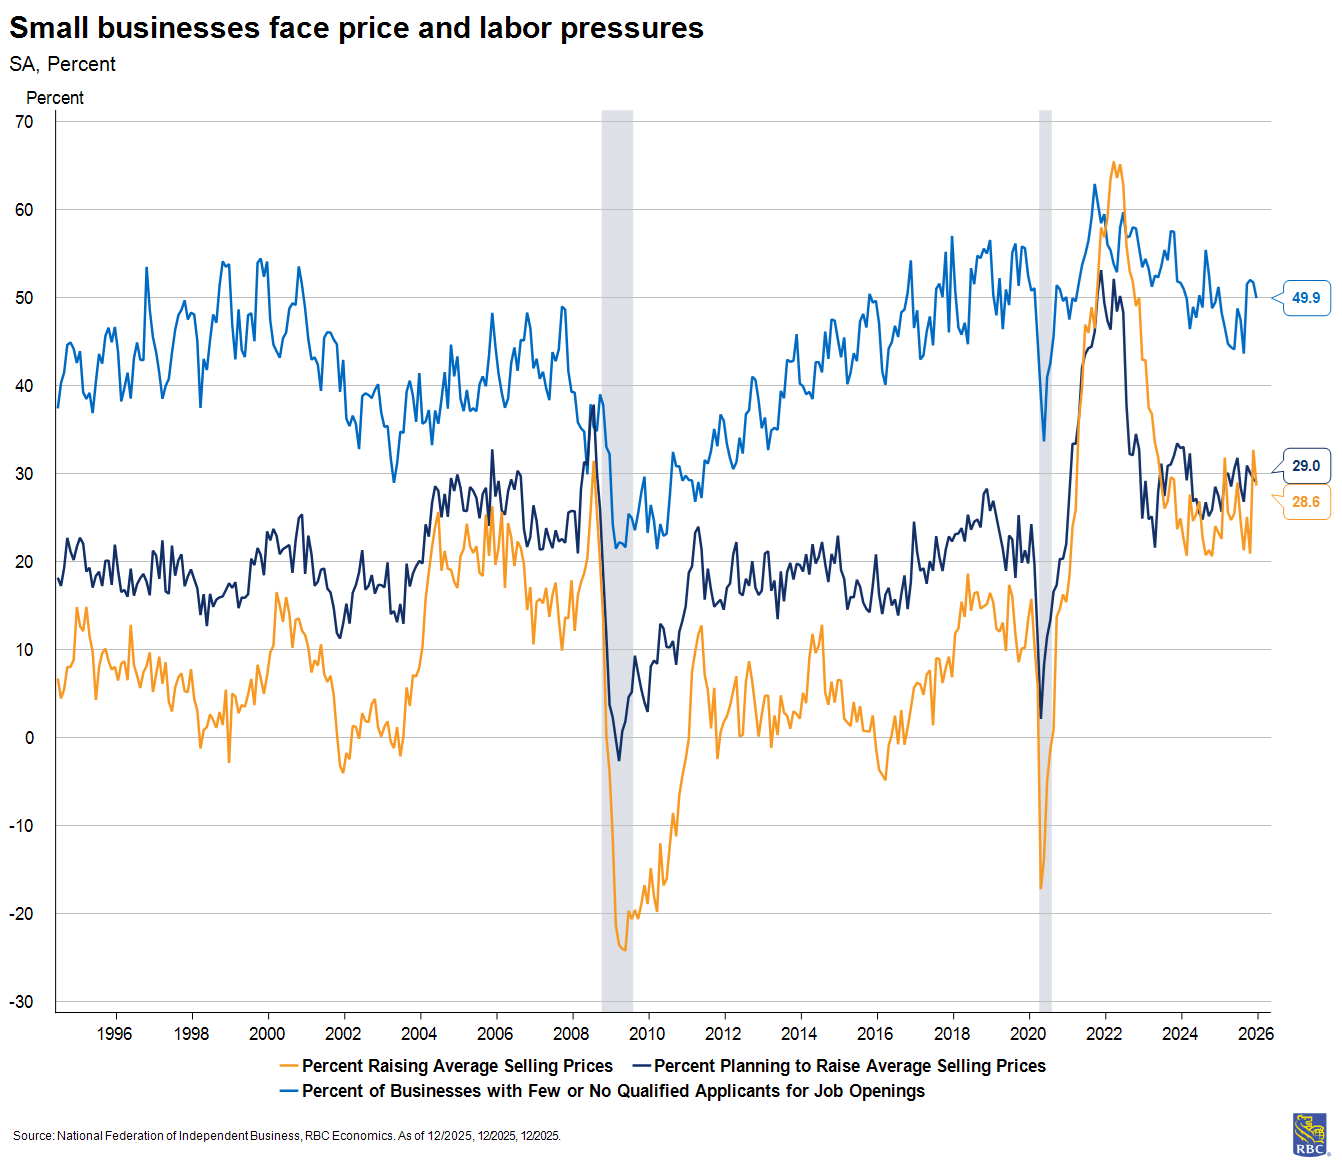
Business surveys reflect the pressures whether you look at ISM, NFIB, or regional Fed surveys. They are all heading in the opposite direction of CPI. In fact, the NFIB (small business survey) shows an elevated share of firms reporting they (1) raised prices, (2) plan to continue to raise prices, and (3) continue to struggle to find qualified labor despite recent market “weakness.”
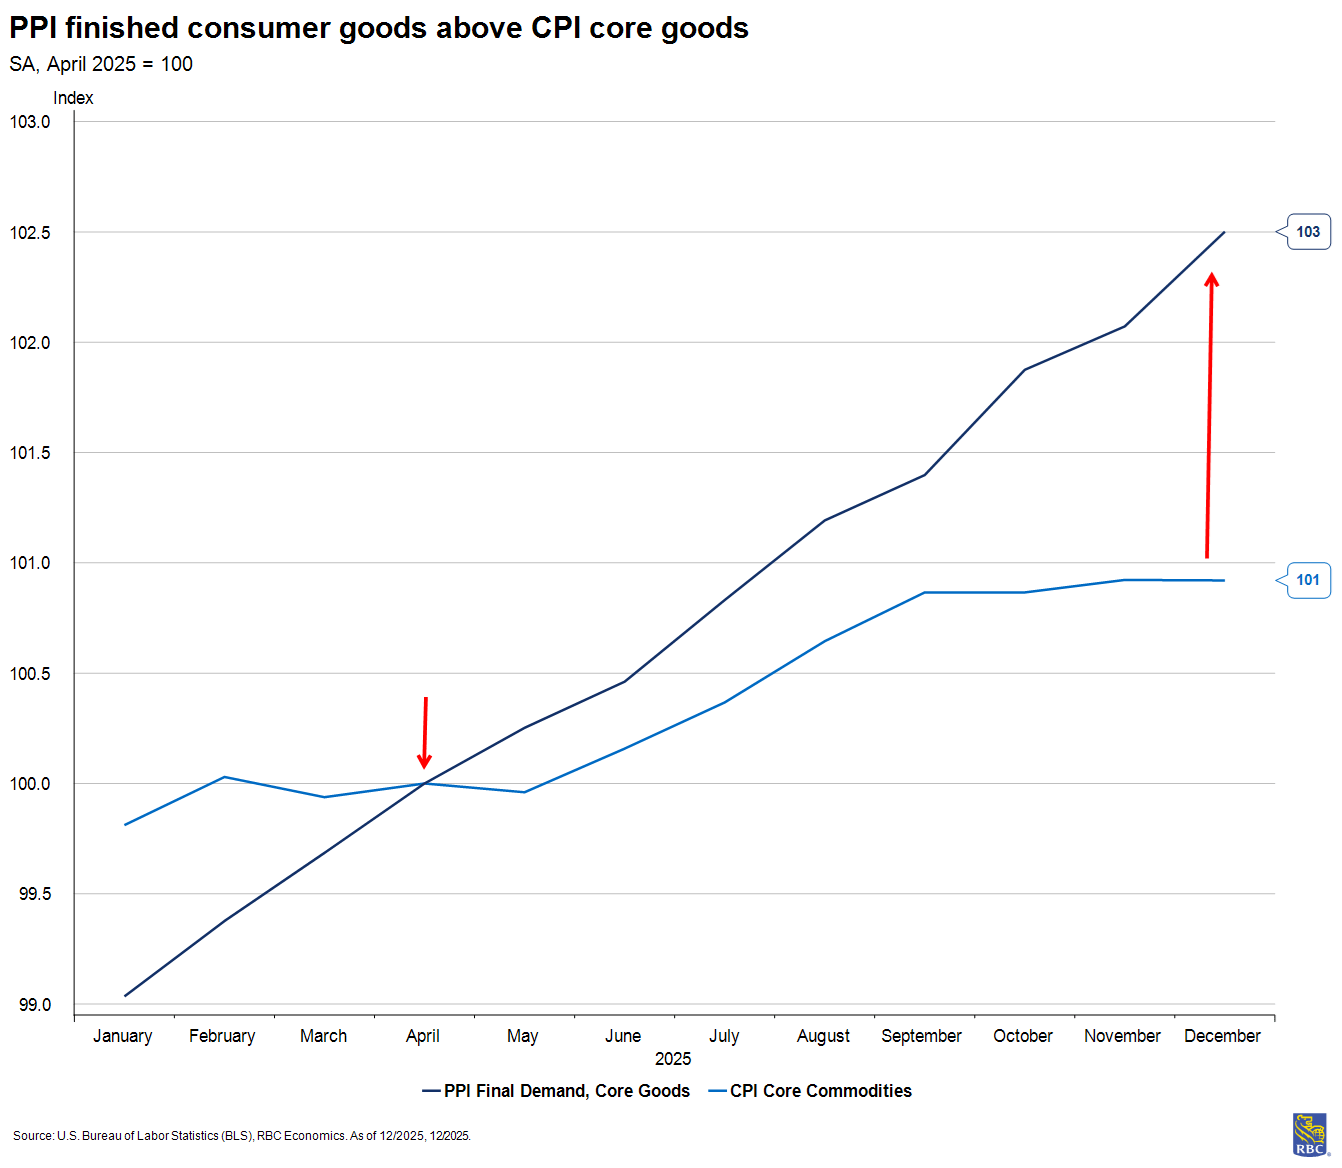
Of note, December’s Producer Price Index (PPI) shows tariff pressure remains in the pipeline and will continue to push consumer prices higher in 2026. The rise in December was driven primarily by services, but don’t conflate the story: the main driver of the spike was in wholesale trade for machinery and equipment. This is a sign of tariff pressure being passed through the supply chain, and it will continue to flow through final production stages and ultimately, to the consumer in the first half of 2026.
Core services ex-housing remains largest contributor to inflation
The main hurdle for inflation’s path back to 2% is core services excluding housing—a measure that’s never been negative on an annual basis in the last 40 years. Put simply, we just don’t expect deflationary pressure from this sector, and more importantly, expect limited disinflation. A large part of this sector is explained by wages—services are labor reliant after all. Given our tight outlook for the labor market (more below), we don’t see a path for wages, and therefore, core services ex-housing to move meaningfully lower.
Importantly, services inflation can be attributed largely to labor market tightness. As a share of Gross Value Added (GVA)—the sector contribution to GDP—compensation of employees accounts for 49% of input costs compared to 46% for the goods sector. But the trade, transportation, and warehousing sector is particularly vulnerable to tariff pressures because of slim margins. Its exposure is nearly seven times that of the goods and services sector. We are concerned the December PPI report won’t be the last time we see the sector’s margins come under pressure.
It’s also a sign the tariff passthrough is moving closer to the consumer along the supply chain. Recall back in April, we were skeptical prices would spike immediately as companies bolstered inventories to delay paying tariffs. Maintaining market share is another reason we suspect many consumer facing companies were reluctant to meaningfully pass through tariff pressures. Indeed, we saw a very strong holiday shopping season.
Housing inflation a story of lagged changes and methodology quirks
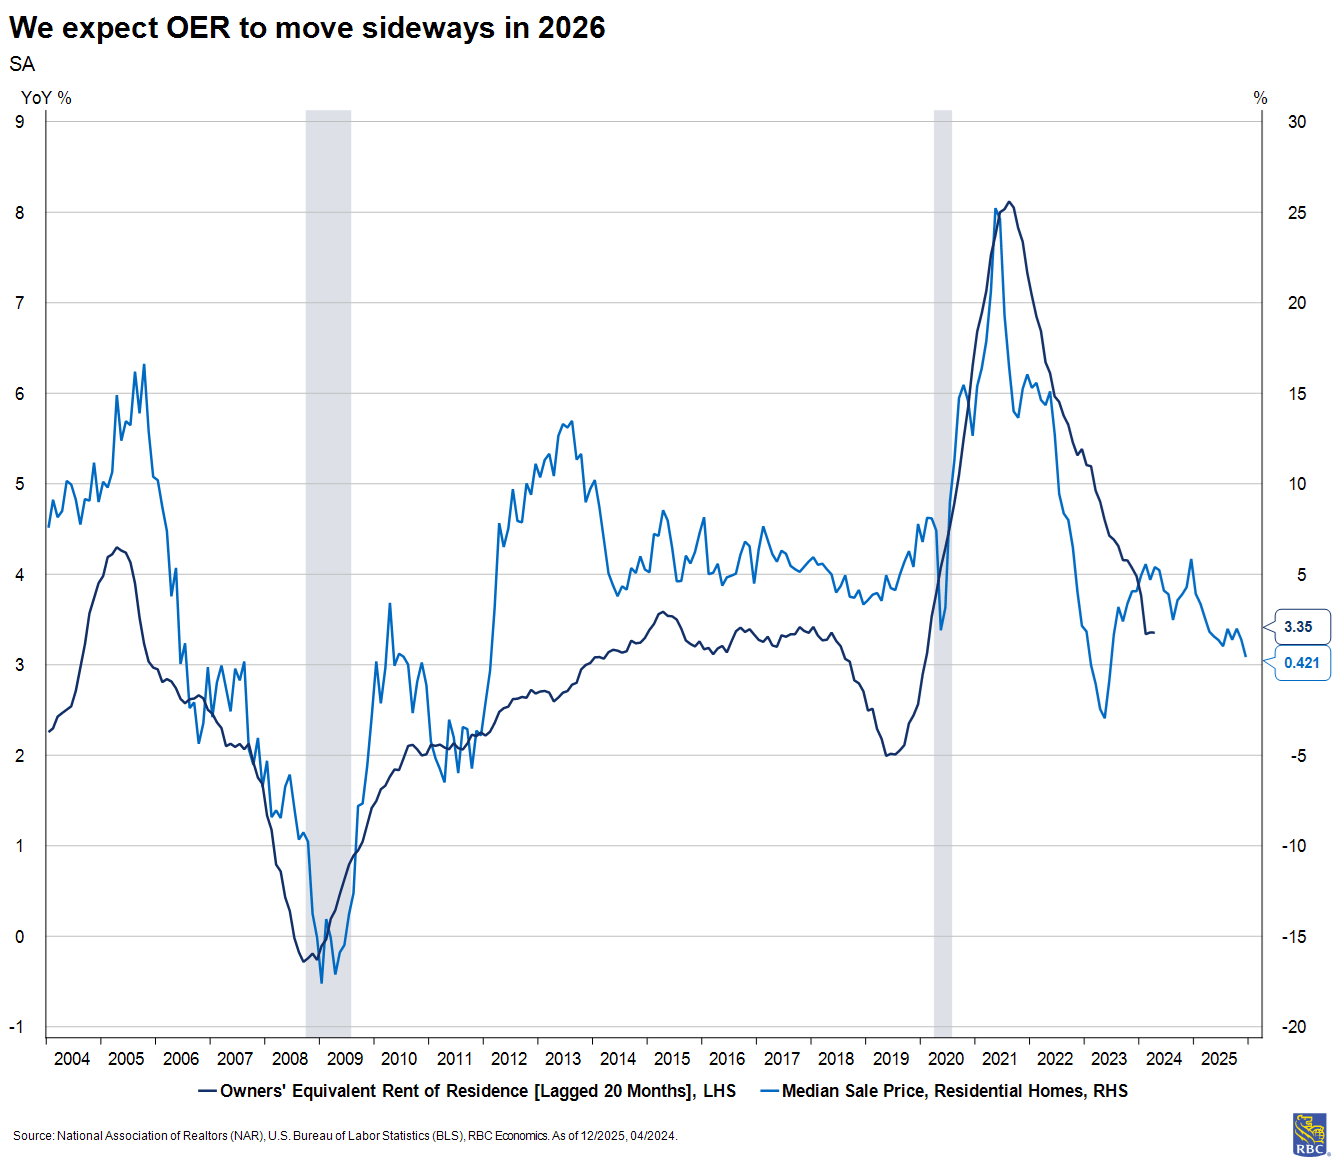
CPI’s measure of housing inflation (OER) lags the housing market significantly—nearly two years behind by our estimate. In that lens, there should be few surprises on OER’s path over the next year because we know how home prices were trending.
While we can appreciate there is further deflation in the pipeline for OER, our model suggests it will be limited in 2026. Put another way, we think the decline in OER will be more meaningful in 2027.
But we remained concerned about the mechanics of OER, specifically with missing October data. We could see a surprise jump depending on the way the Bureau of Labor Statistics corrects for the missing data in April.
Another factor that can contribute to a more modest CPI profile in 2026 will be the re-weighting of the CPI basket. Housing is poised to gain relative weight, while goods are set to lose relative weight.
At face value this sounds favorable for CPI, but it will be less meaningful in the Personal Consumption Expenditures (PCE) measure of inflation (the Fed’s preferred measure). And changing weighting mix is not a meaningful deflationary trend.
In fact, it can ultimately work against CPI as some measures are notoriously lagged—namely auto insurance. We continue to see that sector play catchup in terms of CPI pricing, and if tariffs add to higher auto prices, so too will auto insurance. That sector will gain relative weight in 2026.
Price increases outside of the core basket could weigh on consumer demand
Increasingly, we’re thinking about the sectors that impact the consumer. Goods and services purchased more frequently tend to have a greater impact on confidence and perceptions of inflation for consumers.
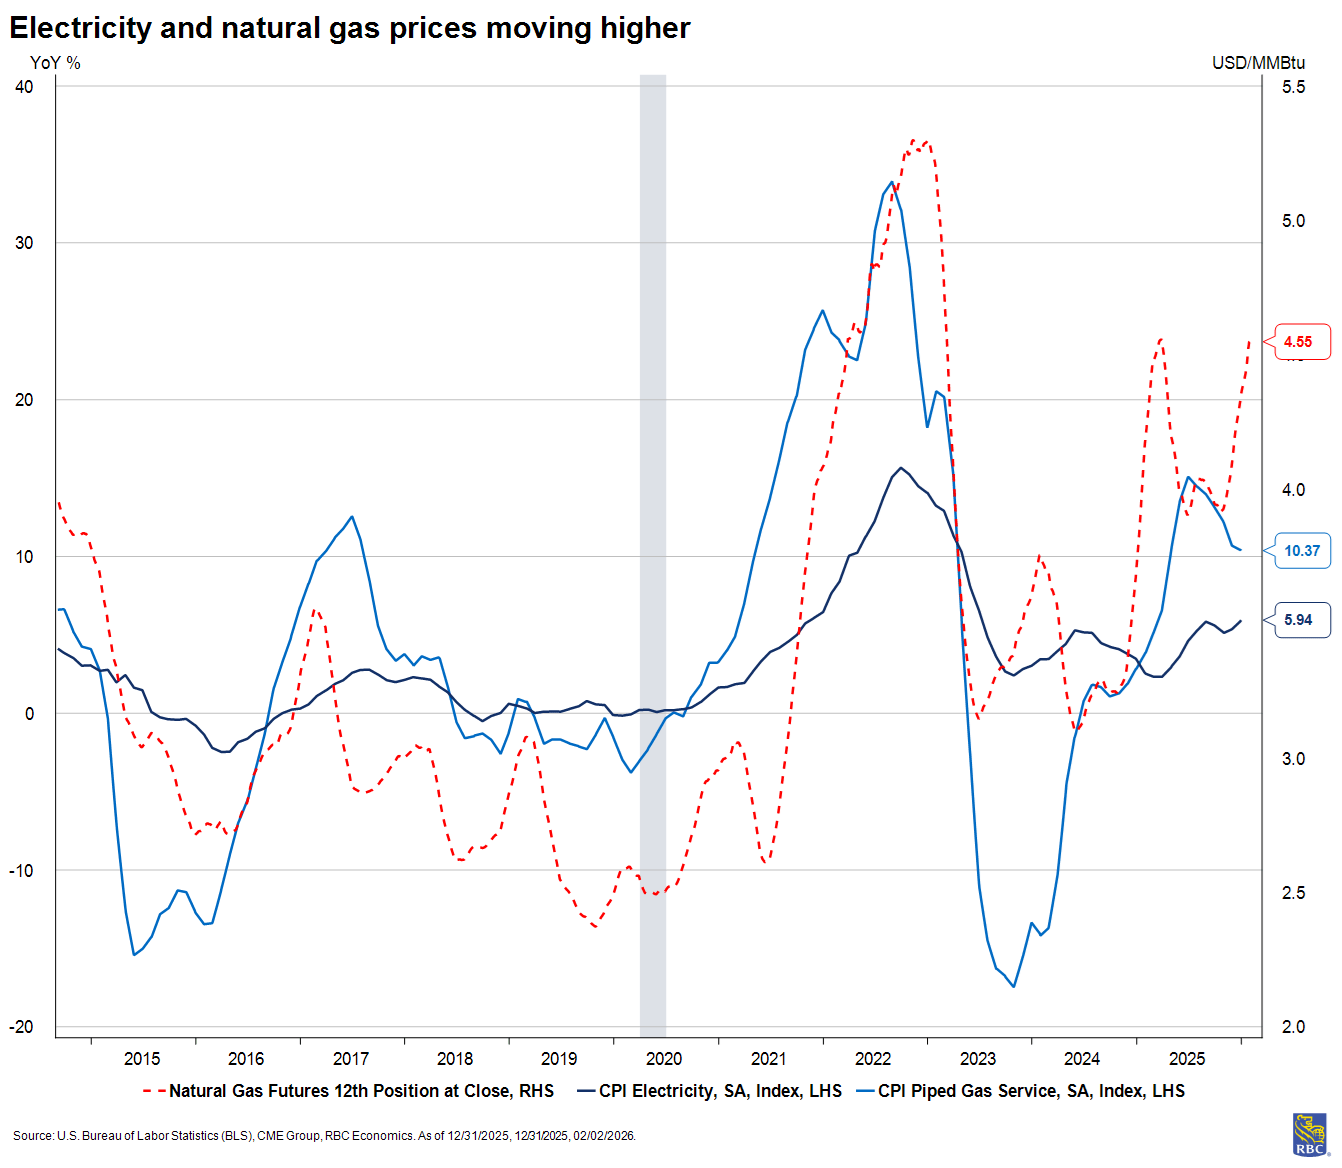
The University of Michigan’s Index of Consumer Sentiment tracks closely with changes in gas prices more than any other good or service because gas prices are easily observable and purchased frequently by consumers. To that end, we’re watching trends in energy, food, and other nondurables goods to assess changes in consumer behavior. It’s worth noting the loss of the ACA health insurance subsidy will certainly weigh on consumer budgets, but it does not factor into the CPI measure of inflation—goods and services that have income-based requirements are not measured by the CPI program.
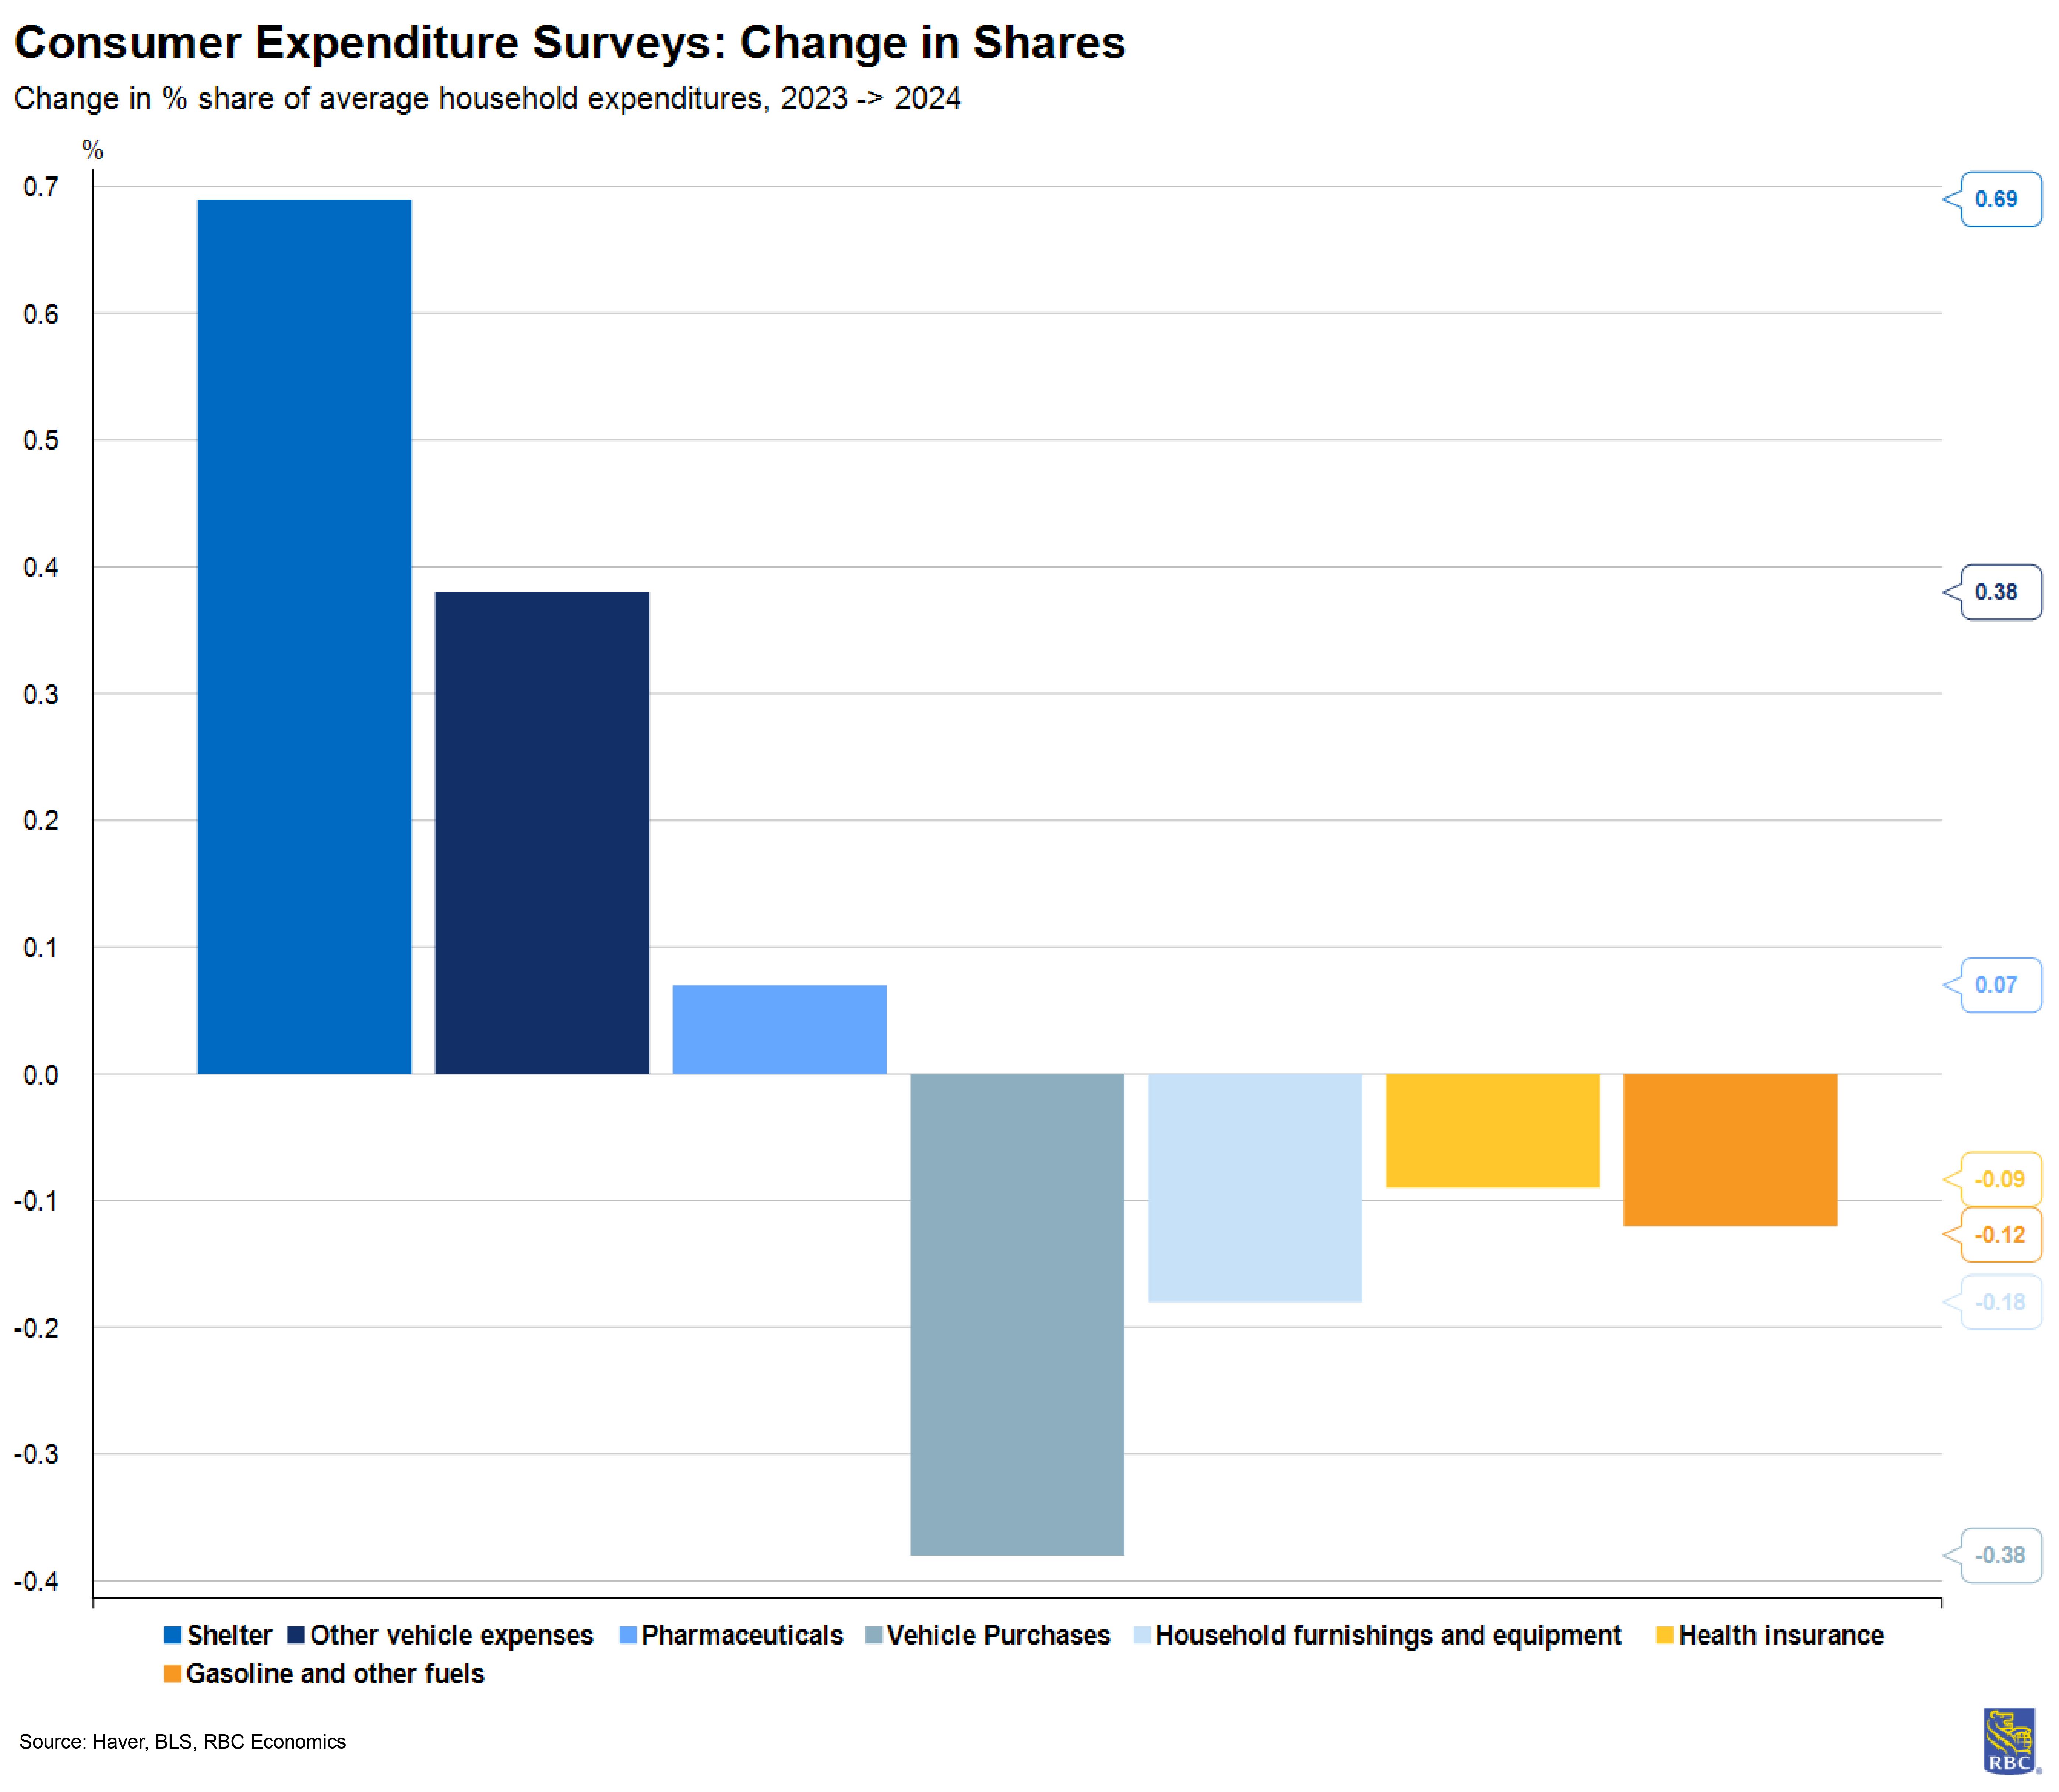
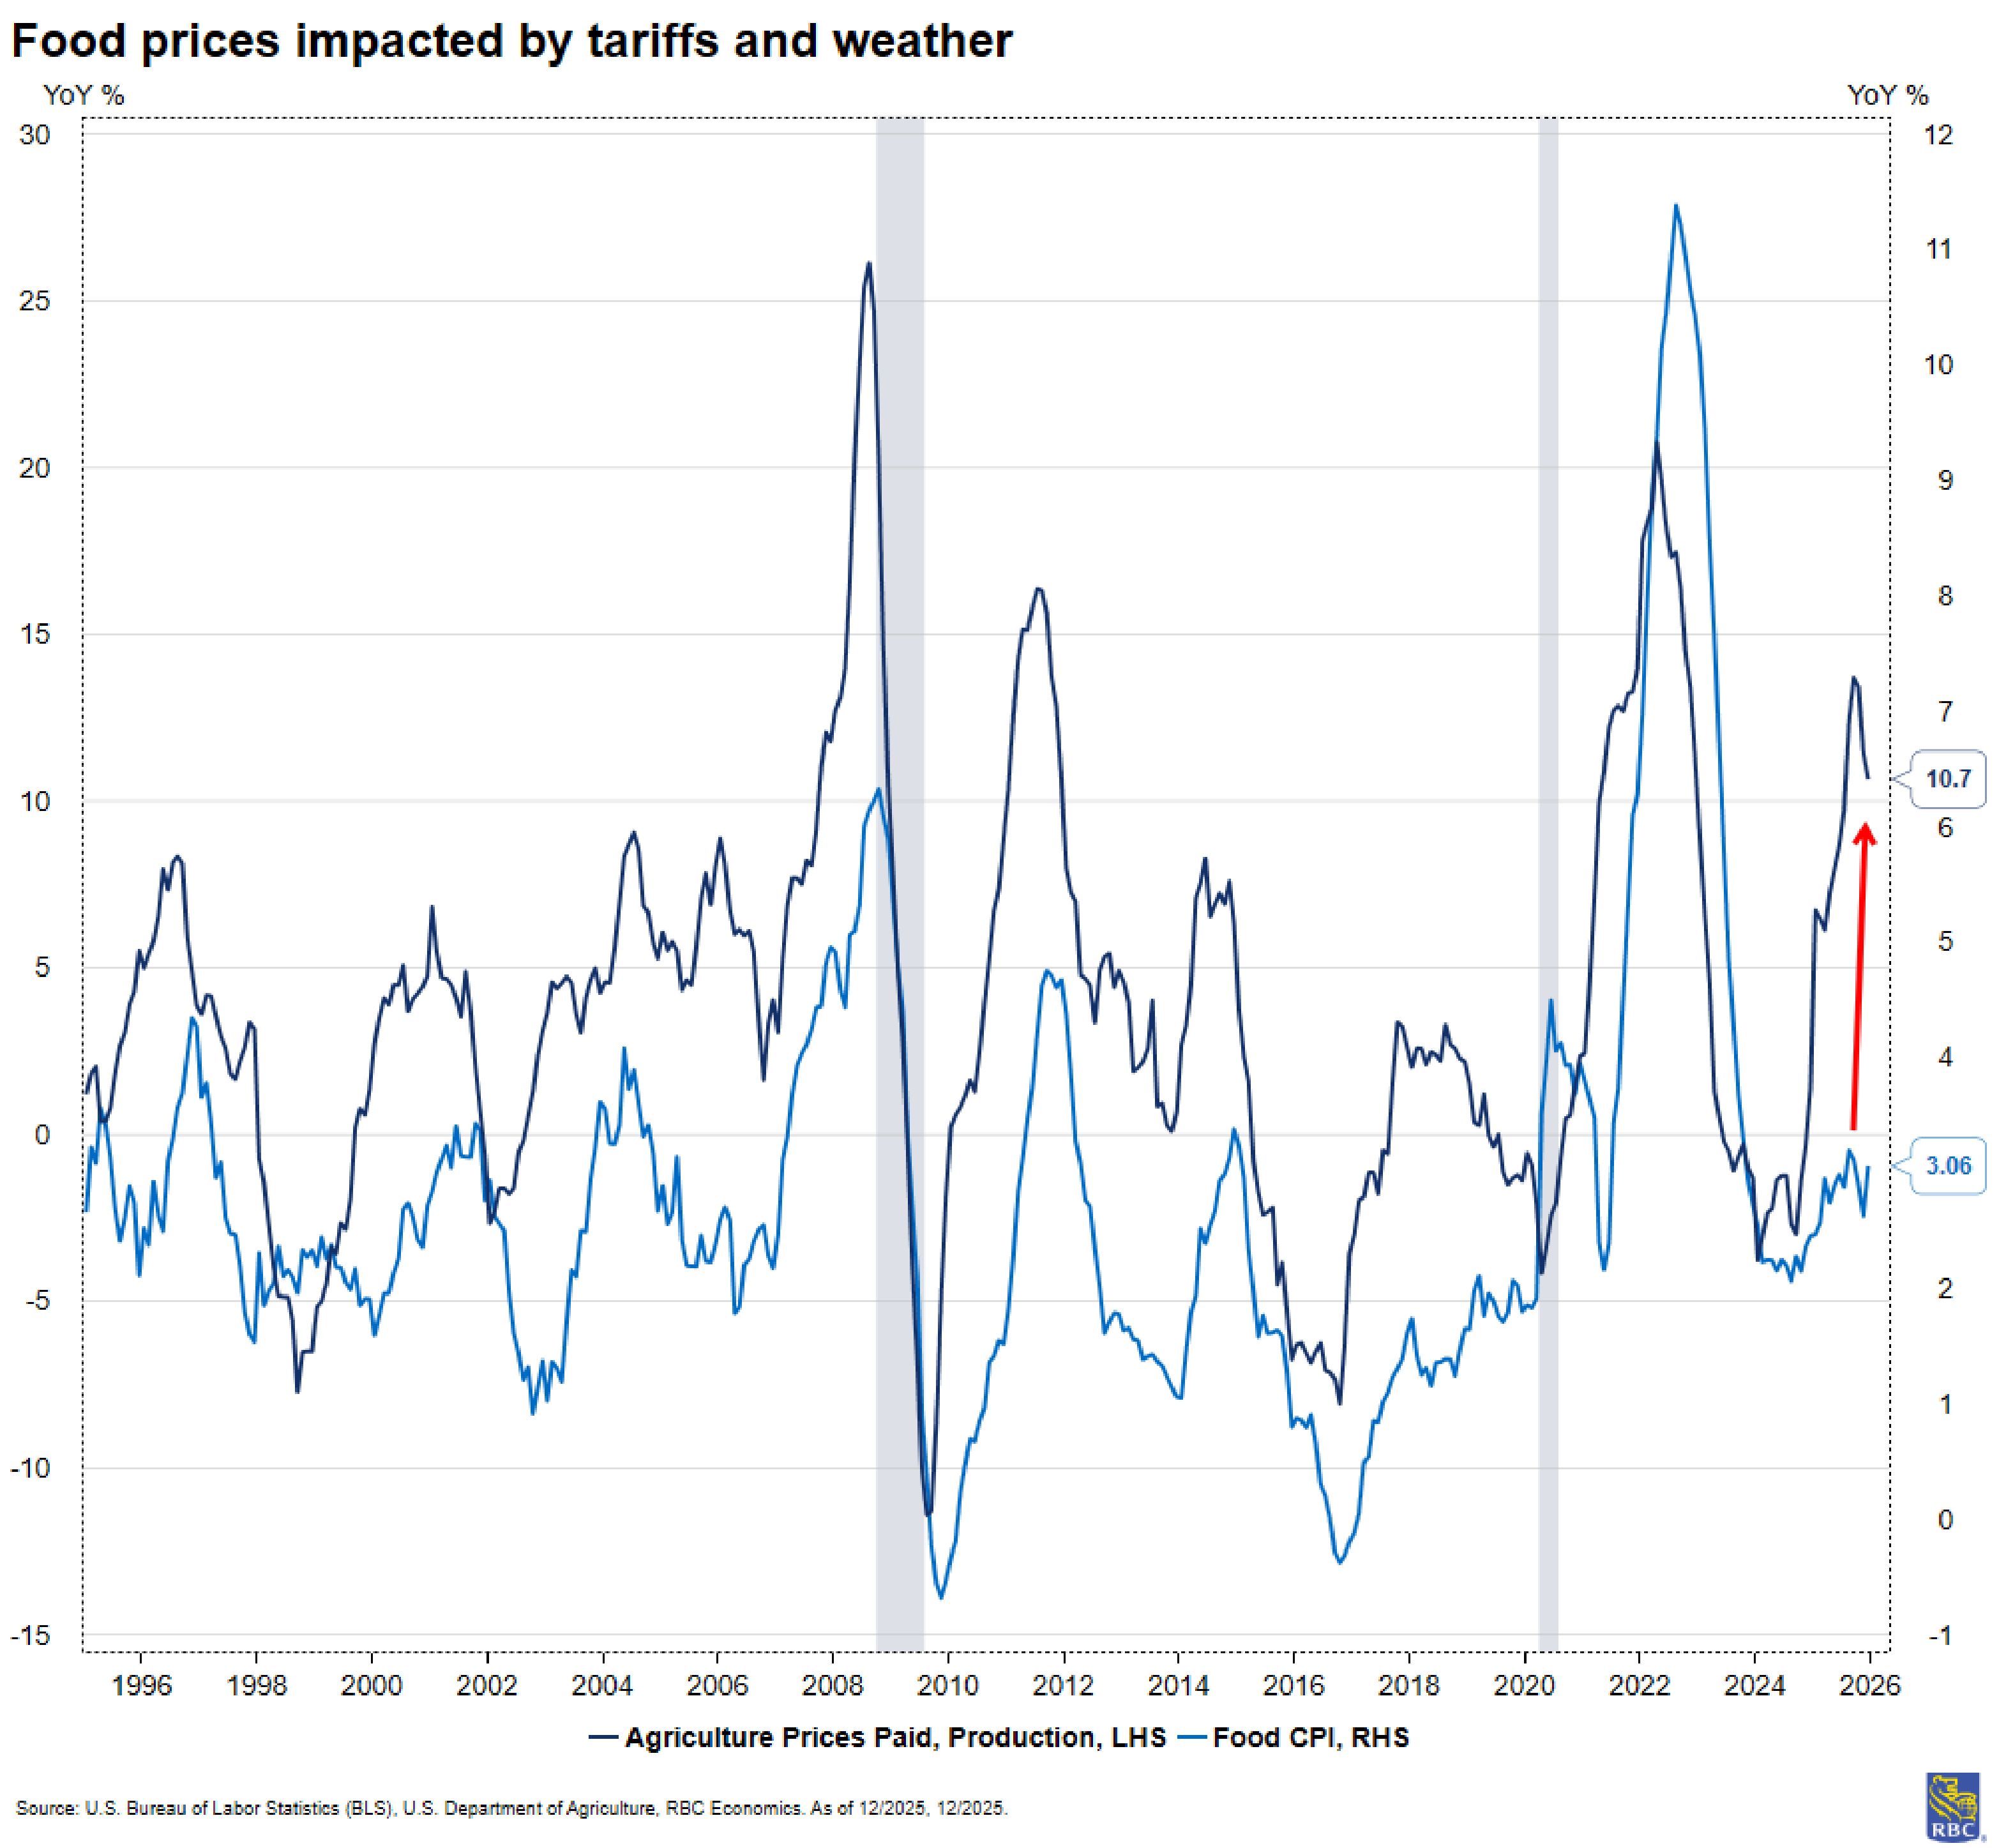
Looking outside trends of the core basket is worrying. Farmer input prices have been trending higher for several months and only just starting to show up in consumer food prices. Energy prices have been volatile due to geopolitical events and weather—factors outside of the Fed’s control. Still, they deserve attention, because they matter to consumer budgets. Combined food, utilities and gasoline accounted for just under 25% of consumer budgets in the 2024 Consumer Expenditure Survey.
What is the Fed watching and what it means for interest rates in 2026?
It should be appreciated that the Fed monitors inflationary pressure through many sources and channels (e.g., CPI, PCE, import/export prices, wages, etc.), but their stated preferred measure is core PCE.
Core inflation as measured by PCE and CPI have presented a similar story throughout 2025, but for much of the year, core CPI reported a higher y/y pace compared to core PCE. Much of the difference is a result of the way each series is measured with respect to scope. For example, CPI excludes employer contributions to medical expenses, weighting (e.g., housing carries a larger weight in CPI), formula (put simply, CPI assumes a fixed quantity bucket, while PCE accounts for substitution), coverage (CPI covers urban consumers while PCE covers all consumers), and data sources (CPI is used as an input for many PCE estimates, but some components are estimated using other sources such as PPI).
Still, November’s report showed core PCE stuck at 2.8%, still well-above the Fed’s target. More recent CPI readings may suggest continued downside, but we think it would be a mistake to place too much weight on that trend.
For one, CPI places a greater weight on housing, which has been doing most of the deflationary work for the CPI basket, but that is mechanically positioned to reverse in April. Secondly, the Fed’s preferred measure is PCE, which isn’t subject to methodological swings at the start of the year. CPI will see its weights adjusted in the January report, and we expect housing will gain more weight in the CPI basket and skew the trend.
This means CPI could present a false hope of lower inflation compared to PCE. In fact, since 1960, core CPI reported a lower reading of y/y inflation versus core PCE only 20% of the time (160 out of 791 monthly readings).
Our forecast calls for core CPI to peak in Q2 this year at 3% once tariff passthrough has largely materialized, and core goods pressures heat up. From there, core inflation is expected to move sideways and plateau through year-end. But, in the context of mentioned distortions, forecasting in this environment necessitates wider confidence intervals than typical.
Mike Reid is Head of U.S. Economics at RBC. He is responsible for generating RBC’s U.S. economic outlook, providing commentary on macro indicators, and producing written analysis around the economic backdrop.
Carrie Freestone is a Senior US Economist at RBC Capital Markets. Carrie is responsible for projecting key US indicators including GDP, employment, consumer spending and inflation for the US. She also contributes to commentary surrounding the US economic backdrop which she delivers to clients through publications, presentations, and the media.
Imri Haggin is an Economist at RBC Capital Markets, where he focuses on thematic research. His prior work has centered on consumer credit dynamics and treasury modeling, with an emphasis on leveraging data to understand behavior.
This article is intended as general information only and is not to be relied upon as constituting legal, financial or other professional advice. The reader is solely liable for any use of the information contained in this document and Royal Bank of Canada (“RBC”) nor any of its affiliates nor any of their respective directors, officers, employees or agents shall be held responsible for any direct or indirect damages arising from the use of this document by the reader. A professional advisor should be consulted regarding your specific situation. Information presented is believed to be factual and up-to-date but we do not guarantee its accuracy and it should not be regarded as a complete analysis of the subjects discussed. All expressions of opinion reflect the judgment of the authors as of the date of publication and are subject to change. No endorsement of any third parties or their advice, opinions, information, products or services is expressly given or implied by Royal Bank of Canada or any of its affiliates.
This document may contain forward-looking statements within the meaning of certain securities laws, which are subject to RBC’s caution regarding forward-looking statements. ESG (including climate) metrics, data and other information contained on this website are or may be based on assumptions, estimates and judgements. For cautionary statements relating to the information on this website, refer to the “Caution regarding forward-looking statements” and the “Important notice regarding this document” sections in our latest climate report or sustainability report, available at: https://www.rbc.com/community-social-impact/reporting-performance/index.html. Except as required by law, none of RBC nor any of its affiliates undertake to update any information in this document.
Get the latest forecasts and analysis from RBC Economics.
Subscribe Now
- Tariffs add to goods inflation but its path was already moving higher
- Core services ex-housing remains largest contributor to inflation
- Housing inflation a story of lagged changes and methodology quirks
- Price increases outside of the core basket could weigh on consumer demand
- What is the Fed watching and what it means for interest rates in 2026?