
Bottom Line:
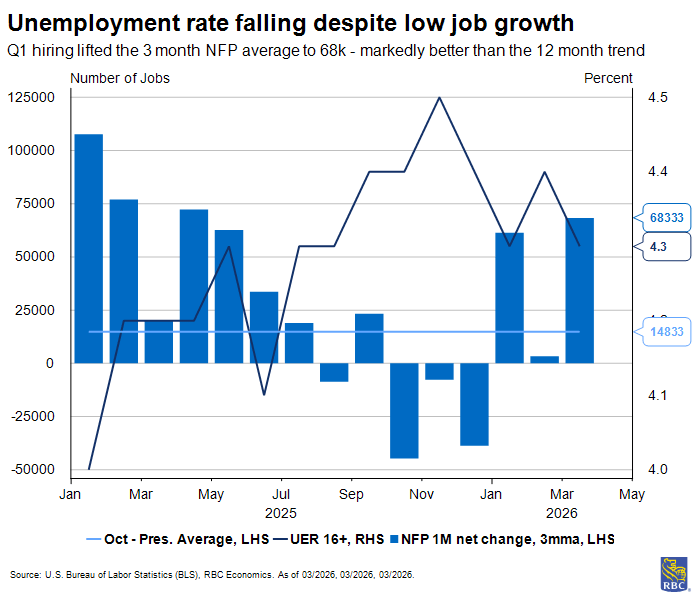
The March employment report surprised to the upside as payrolls added +178k and the unemployment rate ticked down to 4.3%. But in the shadow of a weak February (revised down to -133k), the March gain should not be taken at face value. Still, we view the unemployment rate as the better barometer of labor market health and the improvement there shows that the labor market remains on stable footings despite the volatility in payroll growth.
In fact, much of the volatility should be expected – between SCOTUS overturning IEEPA and the escalation in the Middle East conflict driving oil prices higher, different sectors of the economy will need to react in different ways. The surprise came from sectors that have been most impacted by trade disruptions: manufacturing as well as transportation and warehousing both added jobs in March. Those sectors have largely shed jobs since Liberation Day as uncertain trade policies weighed on hiring. The underlying themes held steady in March as health care remains the largest contributor to job growth (even when correcting for the nurses’ strike that ended).
Construction hiring rebounded after a particularly cold February, driven largely by nonresidential construction (largely a data center story). So too did leisure and hospitality and retail sales, both reflective of a US consumer that continues to spend despite the uncertainty ahead. The most important takeaway from this report should be an appreciation for how low the breakeven rate of payroll growth has fallen (i.e., the number of job gains needed to keep the unemployment rate steady). Even though the labor market has averaged ONLY 15k jobs per month since October, the unemployment rate fell from 4.5% to 4.3%. Importantly, this employment report gives the Fed more time to assess incoming inflation data, and we expect they will remain on pause as their dual mandate faces growing tension.
Here’s what stood out to us in this morning’s report:
1. Unemployment rate fell to 4.3%, driven by fewer job losers and fewer re-entrants
-
The majority of the downshift in unemployment in the household survey can be attributed to fewer job losses in March. We also witnessed a decline in unemployed new entrants and re-entrants.
-
The unemployment rate fell not only for prime-age workers (aged 25 to 54) but also for those under 25 years of age (i.e., recent grads). This is a meaningful improvement in an economy where job search times have lengthened.
-
Concerningly, the U6 unemployment rate ticked up to 8.0% in March, partially reversing February’s improvement as the number of those working part-time for economic reasons increased slightly. This could be an early sign of stress resulting from the conflict in the Middle East.
2. A strong March NFP print does not fully override months of minimal job gains
-
On net, the US economy averaged few jobs over the past six months (+15K) with the majority of gains driven by the health care sector (+85K jobs gains on average over six months) offsetting declines in trade-exposed sectors (-5K over six months).
-
Goods sector hiring has been weak outside of construction and March was the first month that the trade-exposed manufacturing sector added a meaningful number of jobs since 2024.
-
Cyclical services sector hiring has, by and large, been negative on net suggesting that many firms are not backfilling positions that have been left vacant by retirees. The services sector employes a greater number of older workers (55+) vs. the goods sector.
3. The US labor market does not need to create many jobs at this juncture
-
Between February and March, the US economy only added +45K jobs and yet the unemployment rate moved lower. This suggests an exceptionally low rate of breakeven employment.
-
This is unsurprising given the massive wave of retirees as well as the low levels of immigration. Importantly as firms hire new workers, the “gains” are offset by retirees leaving payrolls, meaning job creation is limited. Still, this is largely why we have been seeing low job gains and a stable unemployment rate.
-
We continue to give more weight to the unemployment rate as a gauge of labor market health rather than looking exclusively at payroll data, where sector changes are reflective of policy uncertainty.
Beneath the Surface:
-
Between February and March, the US economy only added +45K jobs and yet the unemployment rate moved lower. This suggests an exceptionally low rate of breakeven employment.
-
This is unsurprising given the massive wave of retirees as well as the low levels of immigration. Importantly as firms hire new workers, the “gains” are offset by retirees leaving payrolls, meaning job creation is limited. Still, this is largely why we have been seeing low job gains and a stable unemployment rate.
-
We continue to give more weight to the unemployment rate as a gauge of labor market health rather than looking exclusively at payroll data, where sector changes are reflective of policy uncertainty.
About the Authors:
Mike Reid is Head of U. Economics at RBC. He is responsible for generating RBC’s U.S. economic outlook, providing commentary on macro indicators, and producing written analysis around the economic backdrop.
Carrie Freestone is a Senior US Economist at RBC. Carrie is responsible for projecting key US indicators including GDP, employment, consumer spending and inflation for the US. She also contributes to commentary surrounding the US economic backdrop which she delivers to clients through publications, presentations, and the media.
Imri Haggin is an US Economist at RBC, where he focuses on thematic research. His prior work has centered on consumer credit dynamics and treasury modeling, with an emphasis on leveraging data to understand behavior.
This article is intended as general information only and is not to be relied upon as constituting legal, financial or other professional advice. The reader is solely liable for any use of the information contained in this document and Royal Bank of Canada (“RBC”) nor any of its affiliates nor any of their respective directors, officers, employees or agents shall be held responsible for any direct or indirect damages arising from the use of this document by the reader. A professional advisor should be consulted regarding your specific situation. Information presented is believed to be factual and up-to-date but we do not guarantee its accuracy and it should not be regarded as a complete analysis of the subjects discussed. All expressions of opinion reflect the judgment of the authors as of the date of publication and are subject to change. No endorsement of any third parties or their advice, opinions, information, products or services is expressly given or implied by Royal Bank of Canada or any of its affiliates.
This document may contain forward-looking statements within the meaning of certain securities laws, which are subject to RBC’s caution regarding forward-looking statements. ESG (including climate) metrics, data and other information contained on this website are or may be based on assumptions, estimates and judgements. For cautionary statements relating to the information on this website, refer to the “Caution regarding forward-looking statements” and the “Important notice regarding this document” sections in our latest climate report or sustainability report, available at: https://www.rbc.com/community-social-impact/reporting-performance/index.html. Except as required by law, none of RBC nor any of its affiliates undertake to update any information in this document.
