
Bottom Line:
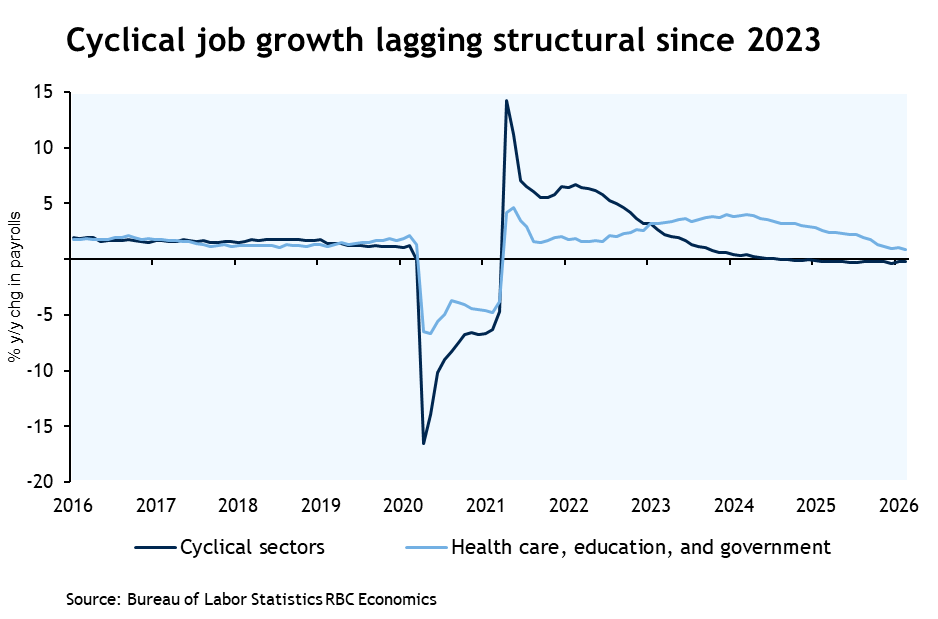
The February employment posted a significant downside (-92K) to payroll employment as the unemployment rate ticked up to 4.4%, reversing prior improvements. The February payroll report showed January’s surge was not sustainable. The report illustrates our key view for 2026: hiring will be structurally driven. If you net out health care, education, and government hiring, there was a sizable slowdown of cyclical hiring in February – both cyclical goods and services sectors shed jobs. The silver lining for health care, however, is that BLS reported a strike that subtracted -31k jobs from payrolls, which will be added back next month.
The uptick in the unemployment rate in February may have surprised markets but jobless claims data during the reference week in February (the week containing the 12th of the month) were well-above the same week in January, signaling upward pressure. The rise in the unemployment rate was driven by primarily by reentrants looking for work (i.e., reflective of the low firing environment), although layoffs and new entrants also rose. Interestingly, the annual population adjustments resulted in a downward adjustment to the participation rate. But with 2 million worker retirements in 2025, this should not be surprising – we expect the LFPR will continue to grind lower.
Beyond the headlines, here’s what stood out to us in the February report:
-
Cyclical weakness prevailed. Trade-exposed sectors (manufacturing, transportation and warehousing) shed a combined -23k jobs. Additionally, temporary help services (often used to backfill the manufacturing sector) shed -6.5k jobs. Most worryingly, however, is the decline in leisure and hospitality. It has declined in 3 of the past 4 months and could be an early sign that discretionary spending by upper income households is slowing.
-
The delayed annual population adjustments resulted in a downward revision to the labor force participation rate.US Census annual population adjustments revealed CPS methodology was overstating the size of the labor force by roughly 1.4 million as of December 2025. Despite the reduction in the labor force, the unemployment rate was unchanged. This tells us that the adjustment reclassified people from unemployment to not in the labor force – likely due to the retirement surge.
-
The February report continued to highlight the notion that breakeven employment is exceptionally low. Since September, hiring has been close to flat, while the unemployment rate has held steady around 4.4%. Low breakeven employment is a product of a high number of worker retirements and lower immigration. Importantly, there is significant hiring that is not showing up as “net new” job creation (i.e., payroll gains) as firms backfill for retirements. Relatively low NFP prints will become the new normal and are not intrinsically “bad”. We think the unemployment rate will continue to be the more reliable gauge of labor market health and we (along with the Fed) will be watching it most closely.
About the Authors
Mike Reid is Head of U.S. Economics at RBC. He is responsible for generating RBC’s U.S. economic outlook, providing commentary on macro indicators, and producing written analysis around the economic backdrop.
Carrie Freestone is a Senior US Economist at RBC Capital Markets. Carrie is responsible for projecting key US indicators including GDP, employment, consumer spending and inflation for the US. She also contributes to commentary surrounding the US economic backdrop which she delivers to clients through publications, presentations, and the media.
Imri Haggin is an Economist at RBC Capital Markets, where he focuses on thematic research. His prior work has centered on consumer credit dynamics and treasury modeling, with an emphasis on leveraging data to understand behavior.
This article is intended as general information only and is not to be relied upon as constituting legal, financial or other professional advice. The reader is solely liable for any use of the information contained in this document and Royal Bank of Canada (“RBC”) nor any of its affiliates nor any of their respective directors, officers, employees or agents shall be held responsible for any direct or indirect damages arising from the use of this document by the reader. A professional advisor should be consulted regarding your specific situation. Information presented is believed to be factual and up-to-date but we do not guarantee its accuracy and it should not be regarded as a complete analysis of the subjects discussed. All expressions of opinion reflect the judgment of the authors as of the date of publication and are subject to change. No endorsement of any third parties or their advice, opinions, information, products or services is expressly given or implied by Royal Bank of Canada or any of its affiliates.
This document may contain forward-looking statements within the meaning of certain securities laws, which are subject to RBC’s caution regarding forward-looking statements. ESG (including climate) metrics, data and other information contained on this website are or may be based on assumptions, estimates and judgements. For cautionary statements relating to the information on this website, refer to the “Caution regarding forward-looking statements” and the “Important notice regarding this document” sections in our latest climate report or sustainability report, available at: https://www.rbc.com/community-social-impact/reporting-performance/index.html. Except as required by law, none of RBC nor any of its affiliates undertake to update any information in this document.
