
This morning’s nonfarm payroll report came in below consensus for December (+50K) after a downward revision for November (+56k).
The Bottom Line:
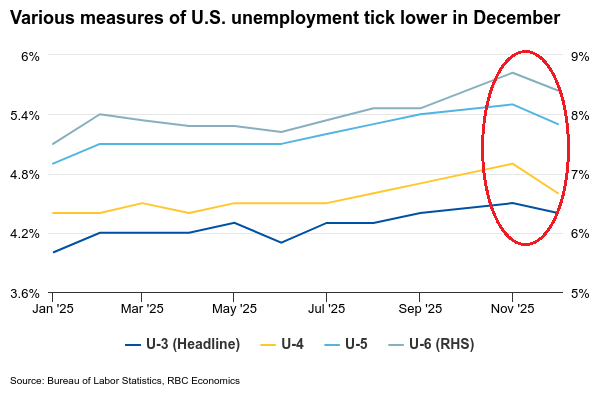
The labor market ends 2025 on better footings than previously thought. The unemployment rate unexpectedly ticked down to 4.4% in December as the economy added 50k jobs. Notably, October saw a sizable downward revision (from -105k to -173k) suggesting the government shutdown had a larger impact on hiring activity than previously estimated. To that end, data quirks continue to add noise to an otherwise subdued labor market. Still, the downward revision of November’s unemployment rate was the result of an annual seasonal factor update, and not a revision of the data collected. What stands out to us is that following the slowdown that started in May, the unemployment rate has only ticked up modestly from 4.3% to 4.4%. despite payrolls averaging only 11k monthly gains over the same period. This suggests the breakeven level of employment could be falling below our prior estimate of 40k per month.
Focusing on the short-term, here’s what stood out to us in the December data:
Sector Spotlight
-
Overall, the goods sector shed jobs in December, with a notable pullback in construction. Trade-exposed sectors (including manufacturing and transportation and warehousing) continued to shed jobs.
-
Professional and business services, which includes temporary help services (typically used as a backfill for manufacturing) also shed jobs in December.
-
Cyclically exposed services sector hiring (i.e. services excluding health care and government) ticked up in December led by a sizable gain in leisure and hospitality (+47k). The sector accounted for 40% of job creation this month and continues to be supported by high earners, wealthy households, and retirees’ spending patterns.
-
Health care and social assistance hiring was relatively soft in December, adding only 39K jobs – the weakest pace in nearly four years! Prior to this morning’s print, the sector averaged a monthly pace of +60K jobs.
-
Also somewhat conflicting, the retail sector continued to shed jobs (-25K) at a time when seasonal hiring typically results in a positive gains. This sector shed 66K jobs in Q4 despite very strong retail sales reports. While this is likely reflective of collateral damage from tariff front-running, we suspect the lack of labor supply is also weighing on seasonal hiring.
Beneath the Surface
-
The unemployment rate ticked lower to 4.4% from November’s revised level (4.5%). We previously estimated the 2025 breakeven employment rate to be around 40K per month, so a 50k print does help push the u-rate lower in that regard.
-
Still, the breakeven pace it is likely moving lower into 2026. This morning’s employment print suggests a downside to that 40K as a massive wave of retirements continues and more stringent immigration policy limits inflows.
-
The labor force participation rate ticked slightly lower to 62.4% from 62.5% the month prior. The volatile U6 unemployment rate also moderated to 8.4% after November’s jump scare.
-
On a monthly basis, average hourly earnings rose +0.3% month-over-month, as expected, an improvement from +0.2% in November. Wage growth continues to be supported by a tight labor market, with the year-over-year pace still exceptionally strong at +3.8%.
Mike Reid is a Director, Head of US Economic Research at RBC. He is responsible for generating RBC’s U.S. economic outlook, providing commentary on macro indicators, and producing written analysis around the economic backdrop.
Carrie Freestone is a Senior US Economist at RBC and a member of the US Economics team at RBC Capital Markets. Carrie is responsible for projecting key US indicators including GDP, employment, consumer spending and inflation for the US. She also contributes to commentary surrounding the US economic backdrop which she delivers to clients through publications, presentations, and the media.
Imri Haggin is an economist at RBC Capital Markets, where he focuses on thematic research. His prior work has centered on consumer credit dynamics and treasury modeling, with an emphasis on leveraging data to understand behavior.
This article is intended as general information only and is not to be relied upon as constituting legal, financial or other professional advice. The reader is solely liable for any use of the information contained in this document and Royal Bank of Canada (“RBC”) nor any of its affiliates nor any of their respective directors, officers, employees or agents shall be held responsible for any direct or indirect damages arising from the use of this document by the reader. A professional advisor should be consulted regarding your specific situation. Information presented is believed to be factual and up-to-date but we do not guarantee its accuracy and it should not be regarded as a complete analysis of the subjects discussed. All expressions of opinion reflect the judgment of the authors as of the date of publication and are subject to change. No endorsement of any third parties or their advice, opinions, information, products or services is expressly given or implied by Royal Bank of Canada or any of its affiliates.
This document may contain forward-looking statements within the meaning of certain securities laws, which are subject to RBC’s caution regarding forward-looking statements. ESG (including climate) metrics, data and other information contained on this website are or may be based on assumptions, estimates and judgements. For cautionary statements relating to the information on this website, refer to the “Caution regarding forward-looking statements” and the “Important notice regarding this document” sections in our latest climate report or sustainability report, available at: https://www.rbc.com/community-social-impact/reporting-performance/index.html. Except as required by law, none of RBC nor any of its affiliates undertake to update any information in this document.
