
An economic puzzle existed in both Canada and the U.S. last year—consumer confidence measures plummeted to an all-time low despite headline resilience in the economies.
One compelling answer for the U.S. has been the narrative of a “K-shaped” economy, where divergence in household realities mirror the letter itself. Wealthier Americans—bolstered by outperformance in income and asset gains—have increased their share of consumption. Thus, they’ve propped up aggregate spending even as most households experience weaker sentiment.
Canada’s picture appears different on the surface, with consumption more evenly distributed across income groups. But that doesn’t mean household experiences are the same.
We explore three important distributional stories around household spending, income, and wealth, using available consumption data through end-2024 as well as income and wealth figures for early 20251. They reveal how Canadian income groups genuinely face common headwinds and tailwinds since pre-pandemic, but also where disparities have emerged.
As lagged 2025 and forward data becomes available, it will test our view of the risks to the softening of distributional unevenness we expect going forward.
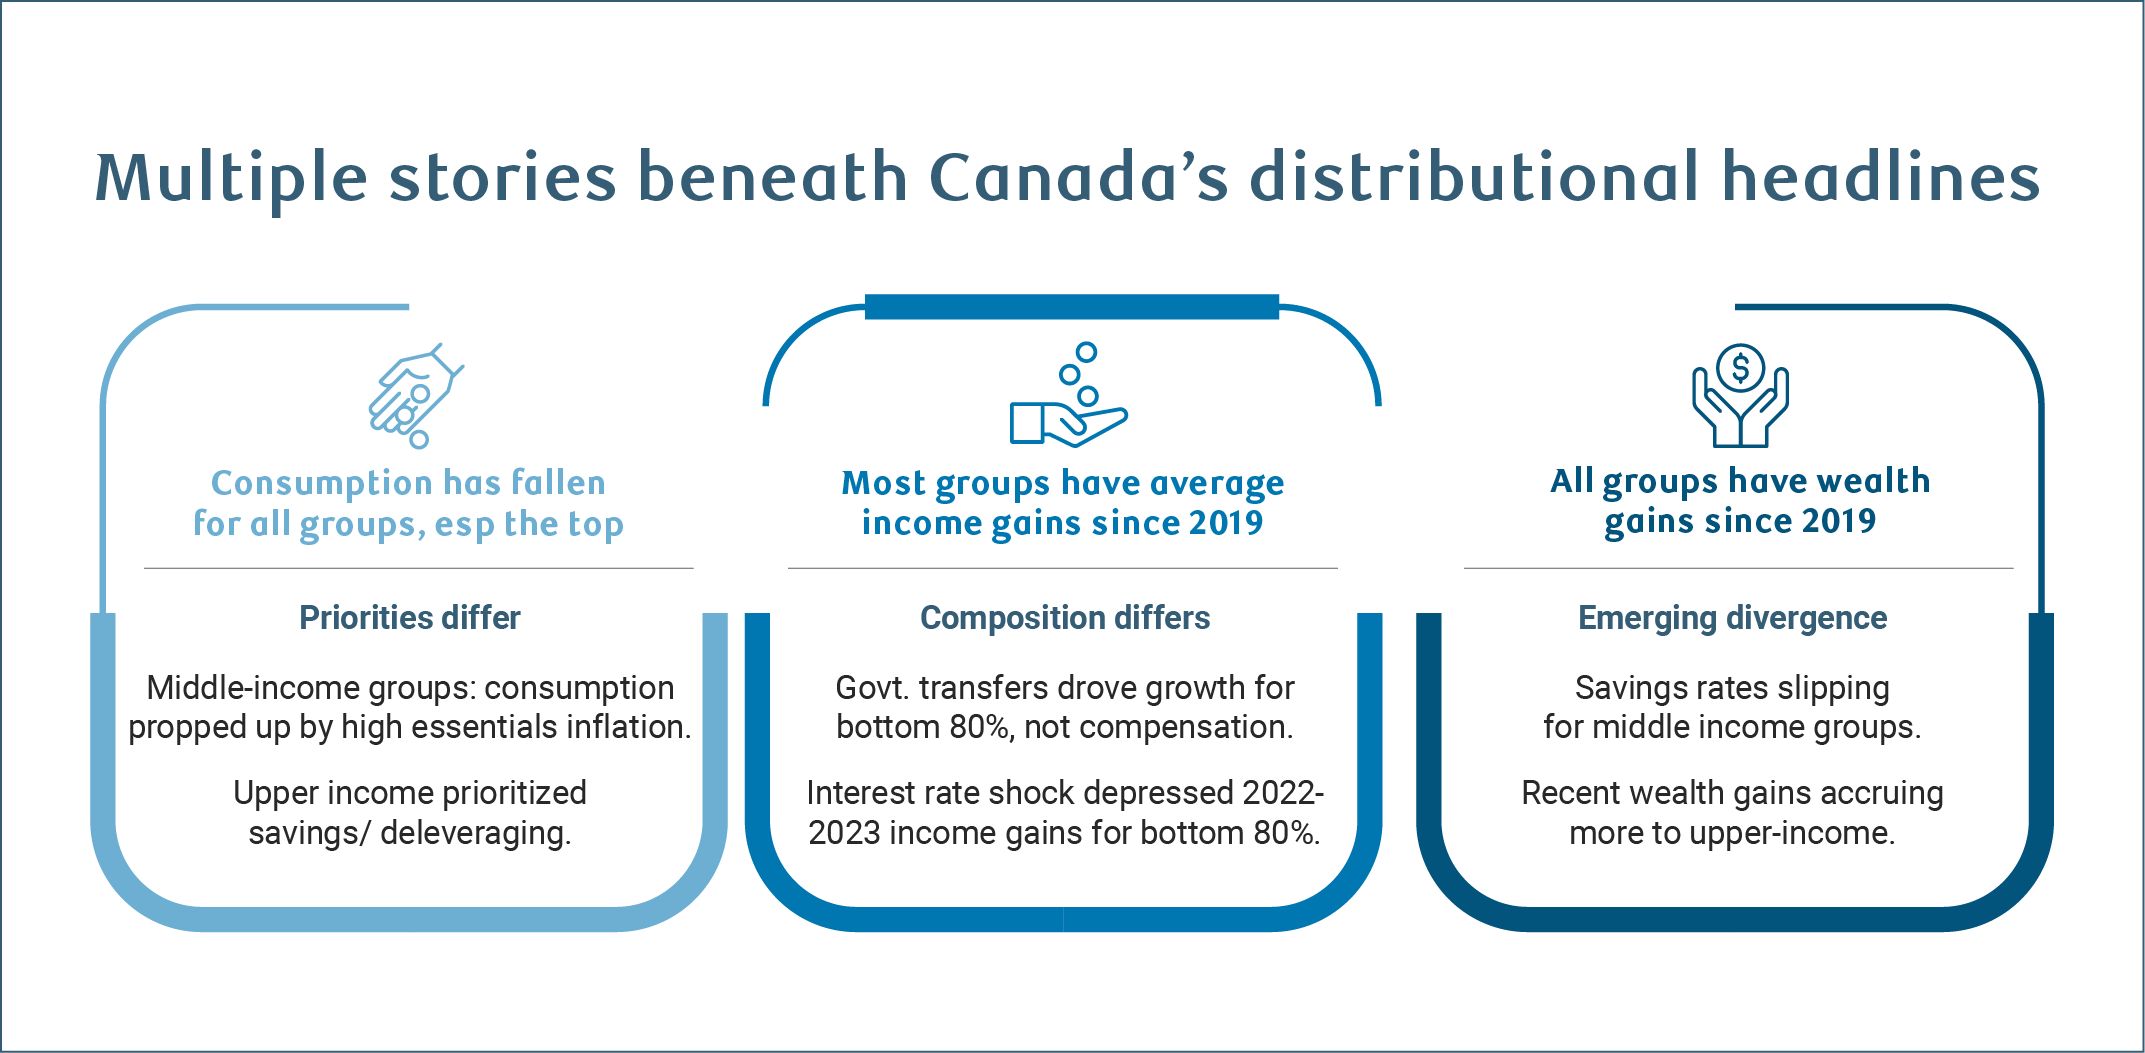
All Canadians pulled back on spending but likely for different reasons
High earners in Canada are not propping up aggregate consumption like they are in the U.S.
Instead, between 2019 and 2024, consumers in every income quintile pulled back average inflation-adjusted spending. This is consistent with depressed consumer confidence metrics, and the well-publicized three years of declines in per-capita GDP growth.
Interestingly, top earners were among those reducing spending the most. But this pullback may have less to do with being acutely economically disadvantaged than having a different set of priorities during the 2022-2023 interest rate shock. Over this period, high-income households shifted away from spending to saving, including a significant pay down of mortgage liabilities from 2022 to 2024.
Conversely, the second and third quintiles saw only minimal changes to their real consumption. This apparent stability, however, conceals underlying strain for these income cohorts, as spending was propped up by essentials—like housing, utilities and food—where prices have climbed faster than headline CPI. Thus, some spending strength among middle-income households may have been involuntary, reflecting a need to maintain essential purchases rather than discretionary spending.
For lower-income households, higher prices are even more difficult to avoid. The relatively small increase in spending on food (even as prices rose) suggests some households substituted away from traditional food spending by increasing food bank usage.
Food bank usage increased 90% between 2019 and 2024, according to Food Banks Canada. Other social transfers in kind, where Statistics Canada records food bank usage, is up nearly 40% for Canada’s lowest income households over the same period compared to 28% across all households.
Key characteristics of Canada’s income quintiles
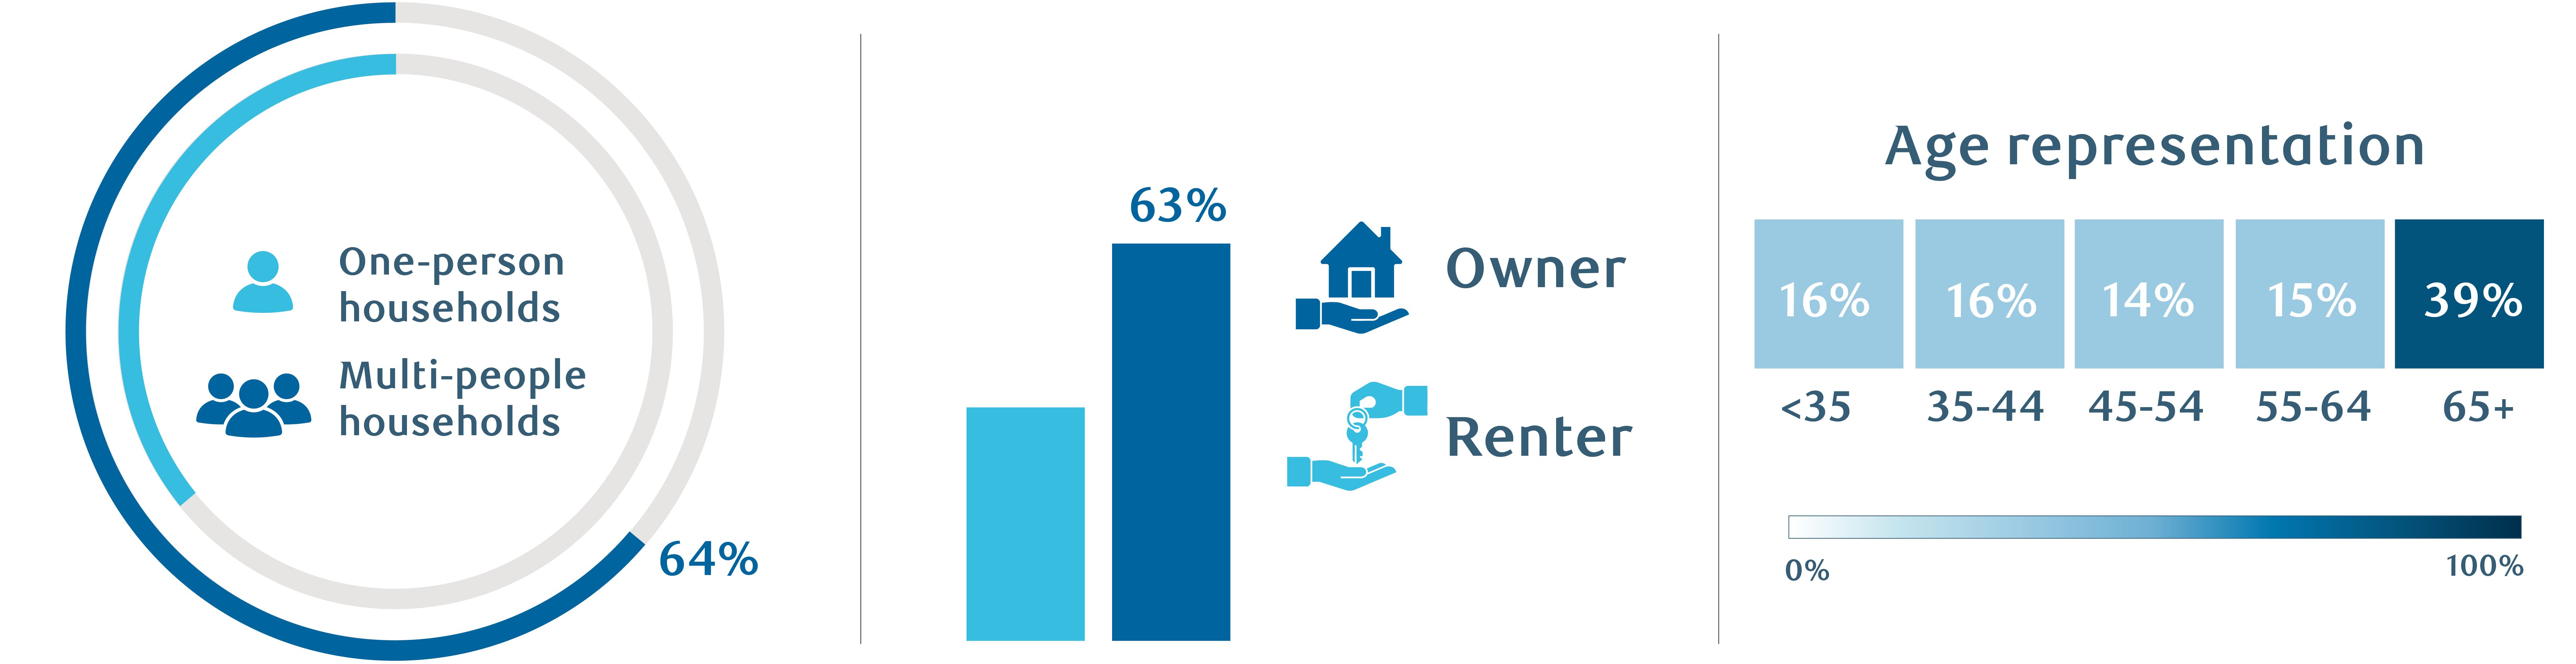
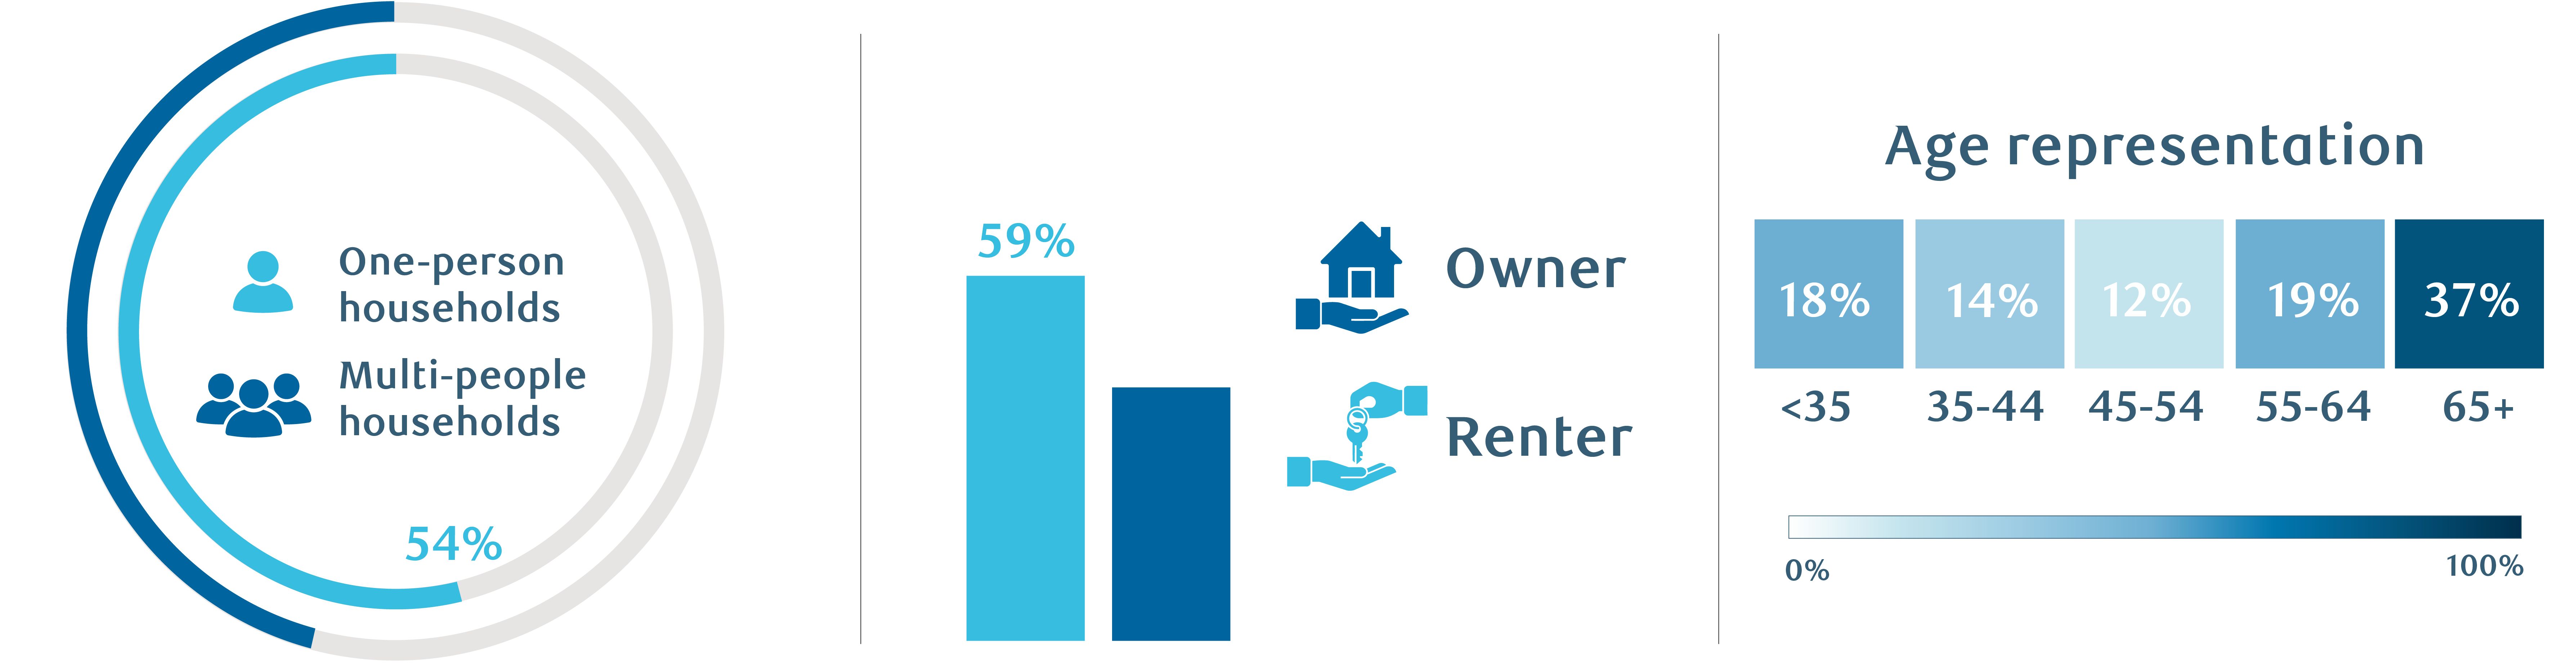
Trends across income quintiles are affected by compositional issues as the exact households making up each quintile can change every period. There’s also heterogeneity within a quintile each period—meaning there’s a significant difference in economic circumstances among people who are relatively close together on the income distribution.
Consider the top income quintile. This group lacks a defined upper bound, lumping together high earners with those barely meeting the entry threshold.
Likewise, older age groups tend to be overrepresented among low-income households despite seniors being Canada’s wealthiest demographic overall. This concentration can introduce bias in spending trends as low-income seniors are more likely to have a savings or accumulated wealth buffer to insulate them from spending constraints faced by other low-income groups.
Mostly broad income gains conceal different compositional makeup
Like spending, there’s plenty of economic divergence among Canadians in income if you look beneath the surface.
A first pass shows most Canadians are better off since the pandemic. That is, most income groups have seen real (i.e., adjusted for inflation) gains in average disposable income over 2020 to 2024 compared to before the pandemic, with lower-income groups seeing the greatest proportionate improvement.
But the gains have not quite been uniform. The third quintile has had no average real income growth over this period, while the income gap – a ratio comparing the income of the top 2 quintiles to that of the bottom 2 – widened slightly as the top’s dollar value gains were still larger.
Critically, the composition of income gains likely matters for households’ perceptions of economic advancement. Three components of disposable income have played very different roles in the gains of various groups, such that zooming in on the narrower 2022 to 2023 period shows that the bottom 80% of the income distribution had negative year-over-year real income growth in these years. During this period, real income gains for high-income households were strongly positive. These components include:
-
Government transfers did the heavy lifting early in the pandemic but wound down significantly.
Transfers were, by far, the most important positive contributor to average real disposable income gains for the bottom four groups between 2019 and 2024. However, the majority of these transfers were concentrated during the pandemic when a surge temporarily reduced income inequality.
-
Compensation growth stalled with weak labour markets.
The bottom four income quintiles experienced inconsistent real compensation gains over 2021 to 2024 such that compensation detracted from average real disposable income growth since before the pandemic. Lower-income households saw the largest negative contribution, consistent with findings that low-wage workers typically bear the brunt of labour market downturns. Upper-income households saw a net positive contribution from compensation.
-
High interest rates imposed additional pressure.
Interest payments surged 40% across all income groups between 2019 and the peak in 2024 but jumped nearly 60% for the bottom quintile. This disparity reflects that lower-income households carry higher debt relative to their income—making them more vulnerable to rate increases. The top income quintile also experienced a material increase in interest payments, but those expenses were more offset by interest income from financial assets for the group as a whole.
Stronger household balance sheets but emerging divergence
Despite economic headwinds, all income groups have improved their net wealth since 2019.
Part of this can be attributed to improved savings rates since pre-pandemic—meaning the share of household income set aside or invested has increased, leading to ‘excess savings’. This is especially true for the top two income quintiles who have sustained savings rates above pre-pandemic norms.
For the bottom three quintiles, who regularly spend more than they earn2, higher savings rates mean accumulating less debt—which is still a net positive for their balance sheets. This improvement occurred during the pandemic, supported by government transfers, but savings rates have since reverted back to pre-pandemic levels or below. The third quintile has particularly seen a higher-than-normal rate of dissavings post-pandemic that has more than canceled out its pandemic-era gains.
Improved savings, however, have not been the primary driver of wealth gains between 2019 and 2024. Appreciation in home prices—up 25% nationally since 2019, despite recent declines—and growth in non-pension financial assets (like from equity market gains) are more important.
Surprisingly, these gains have favoured lower-income groups, leading to a sizeable narrowing of the wealth gap. The ratio comparing the wealth of the top quintile to the bottom two has compressed from 3.2 times in 2019 to 2.1 times in 2024.
Some of this can be explained by the overrepresentation of seniors (who are more likely to be homeowners) in the bottom income quintile. But even excluding wealth gains of those 65 and over, the lowest-income cohort still recorded the fastest wealth growth between 2019 and 2024, albeit by a smaller margin. The lopsided wealth gains in favour of lower-income households is hard to fully explain and is a paradox mirrored in age-related dynamics.
Recently, wealth gains have started to accrue more to upper-income groups (see below).
Two risks for Canada’s uneven distribution in 2025 and beyond
Early distributional income data from 2025 and our own economic growth forecasts are shaping our expectations for how this story will unfold moving forward.
The bottom 80% of the income distribution has already seen some reprieve from stagnant income gains. In 2024, year-over-year growth in real disposable income turned positive with further gains so far in 2025. As a result, the rise in income inequality that emerged in 2022 and 2023 has already shown evidence of softening. Further expected improvement in labour markets this year should help keep the divergence in the economy in check, and lift household sentiment.
However, there are two important risks to this baseline expectation. One is food inflation, which we expect to remain elevated in 2026, growing in the 4% range. Food is about 11% of the household consumption basket across income groups. And, given these are frequent transactions, rising prices can have an outsized influence on economic perspectives.
Second is realized capital gains. Equity markets have been on a tear with the S&P/TSX total return index up over 70% year-to-date to end-February 2026 relative to end-2023. Realized capital gains are not part of the income data above, but other Statistics Canada data available to 2023 suggest they were probably not producing meaningful changes in the distribution of income at that point.
Surging markets could have already changed that given the skewed capital gains distribution: the top 10% of earners typically represent about 70% of realized capital gains. This concentration has already begun reshaping the wealth distribution with recent asset appreciation favouring higher-income households, and reversing some of the prior narrowing of the wealth gap.
About the authors:
Cynthia Leach is Assistant Chief Economist at RBC covering the team’s medium-term economic analysis, including primary research areas of federal and provincial fiscal analysis, structural government policy, and demographics.
Rachel Battaglia is an Economist at RBC, providing forecasts for the Canadian provincial economies and analysing key trends in housing and consumer spending.
There is nuance to distributional analysis where conclusions can change depending on the data set and parameters applied.
Data used herein are from Statistics Canada’s Distribution of Household Economic Accounts for Income, Consumption, Savings and Wealth. This data is timely, aligned with Canada’s quarterly National Accounts, and do not include temporary residents as part of the household sample.
However, there are challenges. One is how the National Accounts alignment limits the income definition. For example, realized capital gains are not included, while imputed rents – the stream of housing services accrued to homeowners (proxied by market rents) which may not feel like income gains – are included in disposable income (they are netted from savings).
The analysis unit for wealth is on a per household basis. Consumption and income analysis are based on consumption units, a weighted measure that accounts for differences in household size and composition.
For example, two people sharing a home typically spend less on housing than two single-person households would separately. By using consumption units, we normalize for these economies of scale, making spending patterns more directly comparable across households.
- Statistics Canada’s quarterly distribution accounts keep consumption shares constant, thus projecting a potentially misleading picture of stability. Thus, we use annual consumption data currently available to end-2024. Quarterly income data – available to 2025q3 – is more informative. ↩︎
- Household composition of income quintiles changes over time, so individual households may see an improvement in financial circumstances over time even if the bottom three quintiles are typically dissaving. ↩︎
This article is intended as general information only and is not to be relied upon as constituting legal, financial or other professional advice. The reader is solely liable for any use of the information contained in this document and Royal Bank of Canada (“RBC”) nor any of its affiliates nor any of their respective directors, officers, employees or agents shall be held responsible for any direct or indirect damages arising from the use of this document by the reader. A professional advisor should be consulted regarding your specific situation. Information presented is believed to be factual and up-to-date but we do not guarantee its accuracy and it should not be regarded as a complete analysis of the subjects discussed. All expressions of opinion reflect the judgment of the authors as of the date of publication and are subject to change. No endorsement of any third parties or their advice, opinions, information, products or services is expressly given or implied by Royal Bank of Canada or any of its affiliates.
This document may contain forward-looking statements within the meaning of certain securities laws, which are subject to RBC’s caution regarding forward-looking statements. ESG (including climate) metrics, data and other information contained on this website are or may be based on assumptions, estimates and judgements. For cautionary statements relating to the information on this website, refer to the “Caution regarding forward-looking statements” and the “Important notice regarding this document” sections in our latest climate report or sustainability report, available at: https://www.rbc.com/community-social-impact/reporting-performance/index.html. Except as required by law, none of RBC nor any of its affiliates undertake to update any information in this document.
