
This week provided the first glimpse of the impact the Middle East conflict is having on inflation. Headline CPI posted a massive +0.9% m/m spike. Whether this persists in the months to come is highly uncertain, as a ceasefire with Iran is underway. But given the fluid situation, we do not have much clarity on where WTI will settle. Importantly, for the Fed, inflation is unlikely to fall meaningfully below 3% in the near term.
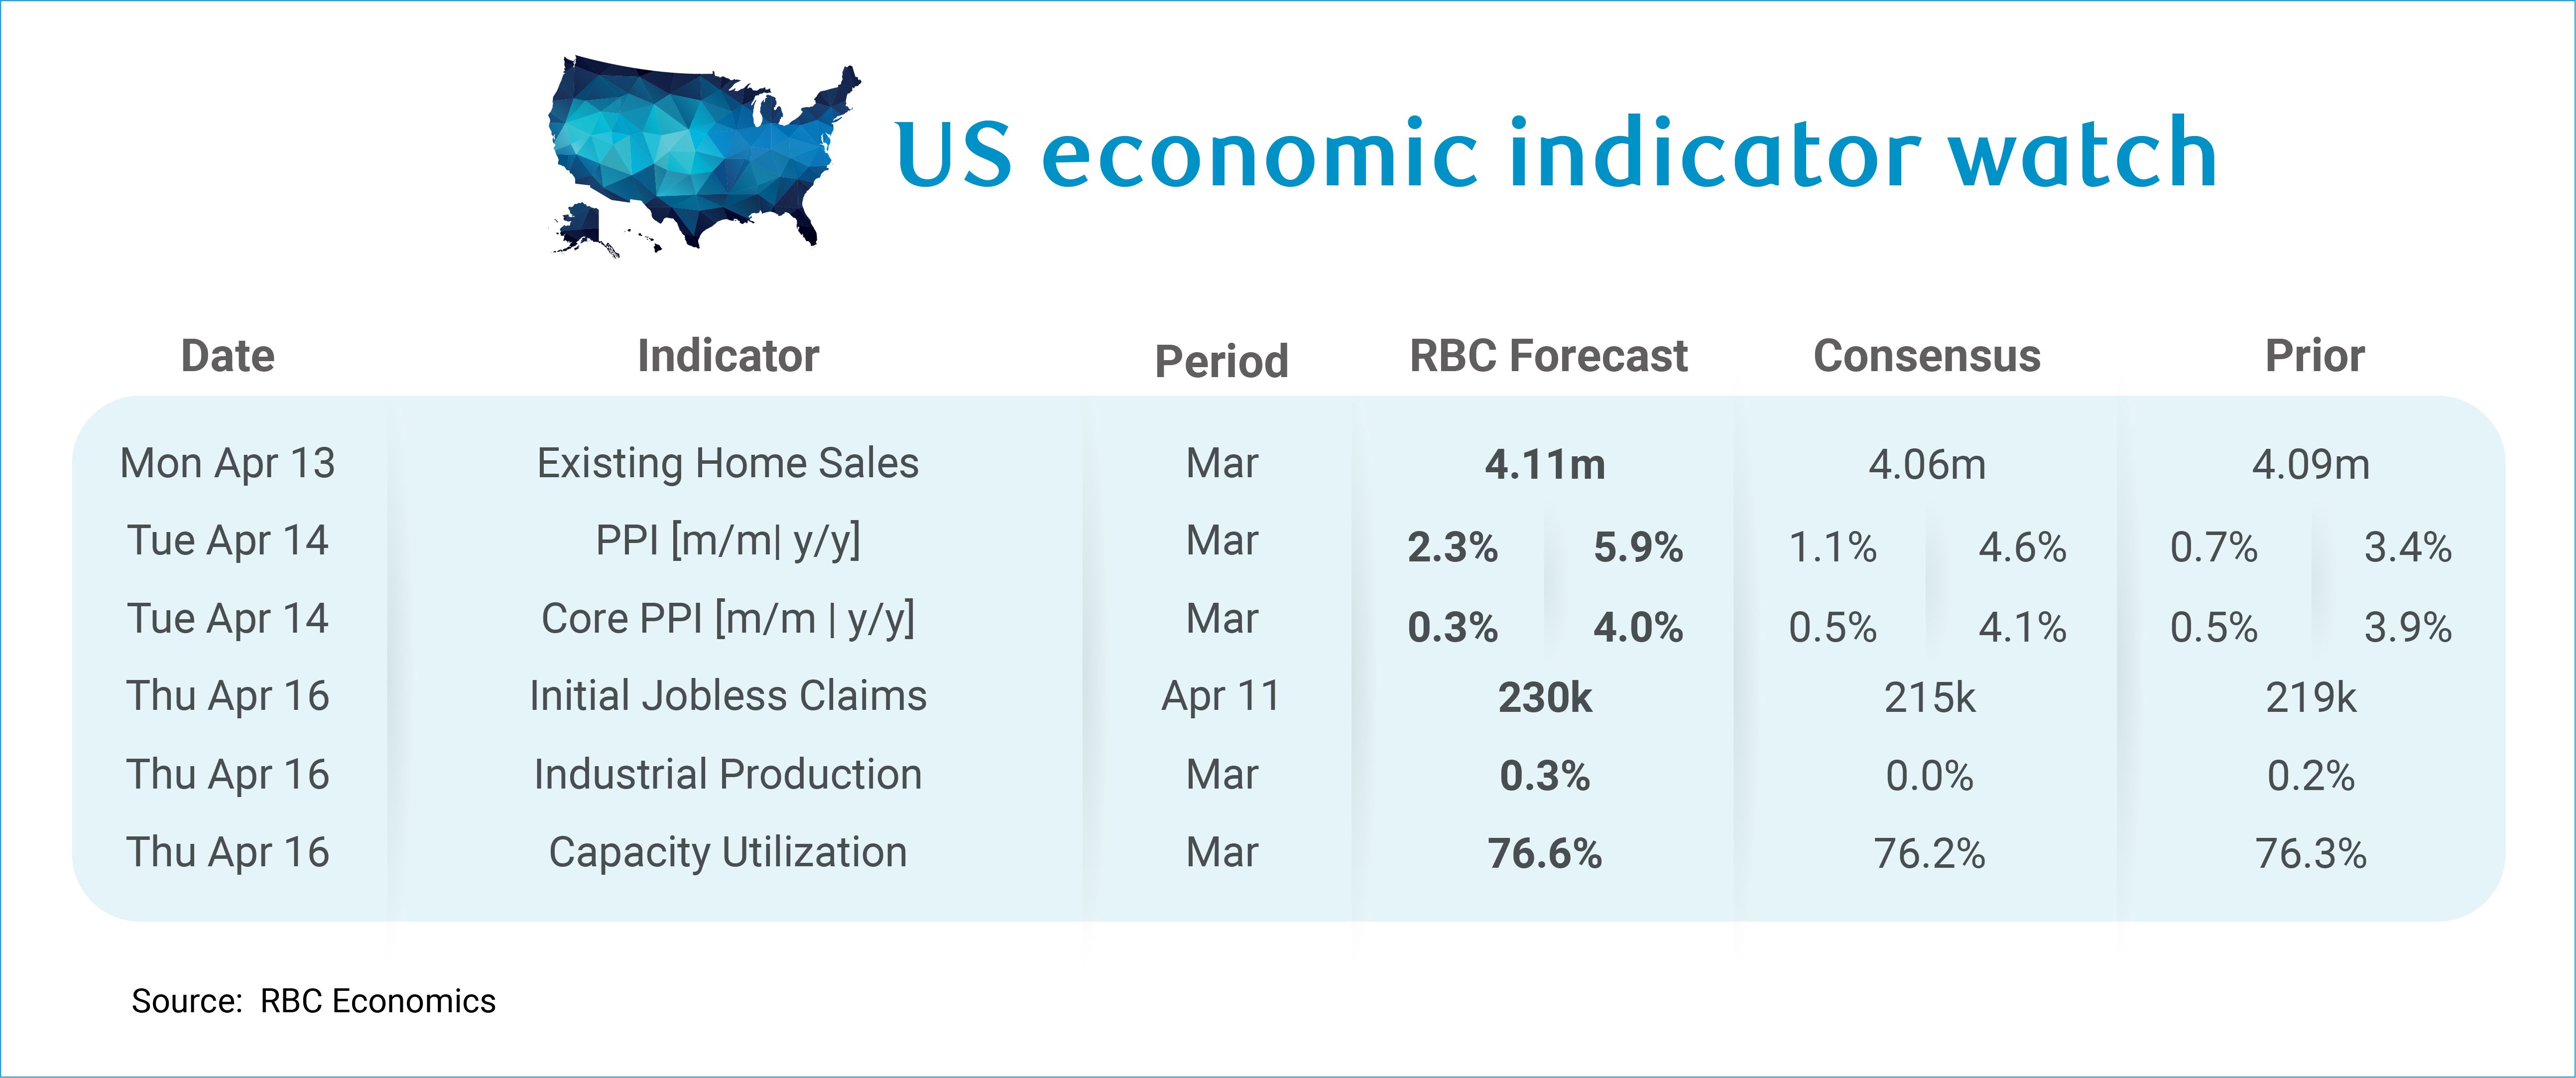
Next week the March PPI data is expected to post a significant spike – a result of higher oil prices. The PPI metric measures average monthly price changes. With average oil prices (WTI) +41% m/m, our forecast calls for a +2.3% m/m rise in headline PPI, pushing the y/y pace up to 5.9%. We expect to see core PPI increase +0.3% m/m, bringing the year-over-year figure to 4.1%.
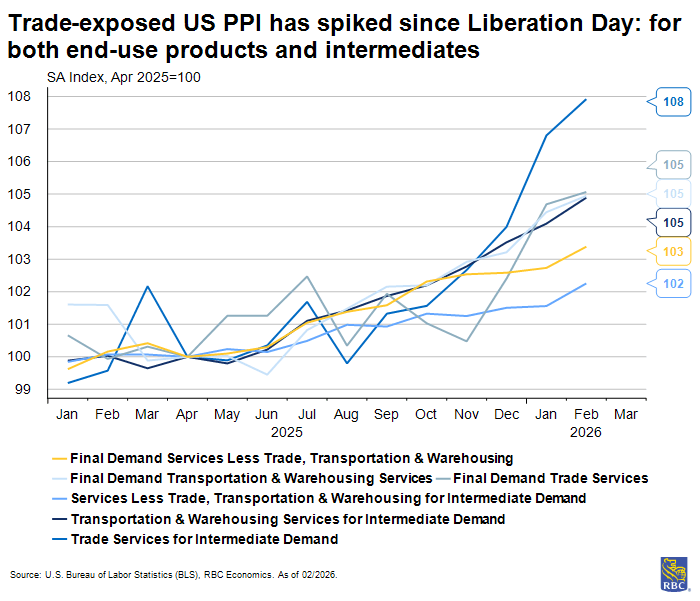
Headline PPI has accelerated the past 4 months, and the trend is concerning. The most recent spike was largely driven by the transportation and warehousing as well as trade services sectors. The rise in trade services reflects wholesale margins – the difference between the wholesaler’s cost of acquisition for a good and the price they charge to retailers. Therefore, the spike in trade services PPI suggests wholesalers are passing along higher costs. Tariff passthrough is already showing up in the CPI data, notably within apparel, motor vehicle parts and equipment, recreation commodities and personal care product sectors which are up between 3 and 4% since last April (i.e., Liberation Day).
Compounding pressures in both core goods and energy prices solidify our view that the Fed will remain on the sidelines at the April meeting and likely stay on pause through the remainder of the year. If oil prices stay elevated for an extended period, the risk of secondary inflationary impacts will grow and would likely weigh on margins of trade exposed sectors face the tradeoff of continuing to raise prices or lay off workers.
Aside from PPI, here’s what else we’re watching next week:
-
Existing home sales will likely come in slightly stronger in March – though sales will remain exceptionally low (below GFC levels when adjusting for population growth). Pending home sales ramped up in February relative to January, which typically signals improvement. However, we do not think this will be enough to nudge sales out of the deep freeze initiated by sticky long-end rates which have edged higher amid the conflict in the Middle East.
-
We expect to see a stronger initial claims print (+230K) for the week of April 11th. As we saw in both ISM Services and Manufacturing reports for March, the prices paid indices surged and hiring was weaker. Businesses facing higher input costs and are either slowing hiring or starting to think about layoffs. Still, +230k is still a relatively low number and we will not be concerned unless we continue to see claims tick up in the weeks ahead.
-
Industrial production is expected to rise +0.3% m/m in March. A stronger ISM manufacturing reading in March suggests activity picked up, with the production index improving by 1.6ppts. The new orders index remained in expansion territory for the third consecutive month and should support industrial production growth in the next few months.
About the Authors:
Mike Reid is Head of US Economics at RBC. He is responsible for generating RBC’s US economic outlook, providing commentary on macro indicators, and producing written analysis around the economic backdrop.
Carrie Freestone is a Senior US Economist at RBC. Carrie is responsible for projecting key US indicators including GDP, employment, consumer spending and inflation for the US. She also contributes to commentary surrounding the US economic backdrop which she delivers to clients through publications, presentations, and the media.
Imri Haggin is an US Economist at RBC, where he focuses on thematic research. His prior work has centered on consumer credit dynamics and treasury modeling, with an emphasis on leveraging data to understand behavior.
This article is intended as general information only and is not to be relied upon as constituting legal, financial or other professional advice. The reader is solely liable for any use of the information contained in this document and Royal Bank of Canada (“RBC”) nor any of its affiliates nor any of their respective directors, officers, employees or agents shall be held responsible for any direct or indirect damages arising from the use of this document by the reader. A professional advisor should be consulted regarding your specific situation. Information presented is believed to be factual and up-to-date but we do not guarantee its accuracy and it should not be regarded as a complete analysis of the subjects discussed. All expressions of opinion reflect the judgment of the authors as of the date of publication and are subject to change. No endorsement of any third parties or their advice, opinions, information, products or services is expressly given or implied by Royal Bank of Canada or any of its affiliates.
This document may contain forward-looking statements within the meaning of certain securities laws, which are subject to RBC’s caution regarding forward-looking statements. ESG (including climate) metrics, data and other information contained on this website are or may be based on assumptions, estimates and judgements. For cautionary statements relating to the information on this website, refer to the “Caution regarding forward-looking statements” and the “Important notice regarding this document” sections in our latest climate report or sustainability report, available at: https://www.rbc.com/community-social-impact/reporting-performance/index.html. Except as required by law, none of RBC nor any of its affiliates undertake to update any information in this document.
