
Tracking inventories held by US businesses as a gauge of economic health can provide helpful signals for the direction of growth in the economy.
A change in inventory levels can inform us about changes in demand for key inputs, finished goods, and the broader demand backdrop.
Importantly, they can also serve as an indicator of supply conditions—inventories can fluctuate due to policy shocks, shipping disruptions, and labor disputes at ports.
We explain how inventories are measured, what changes in inventories can signal, and what these mean for GDP growth.
Inventories as measured by BEA in the national accounts
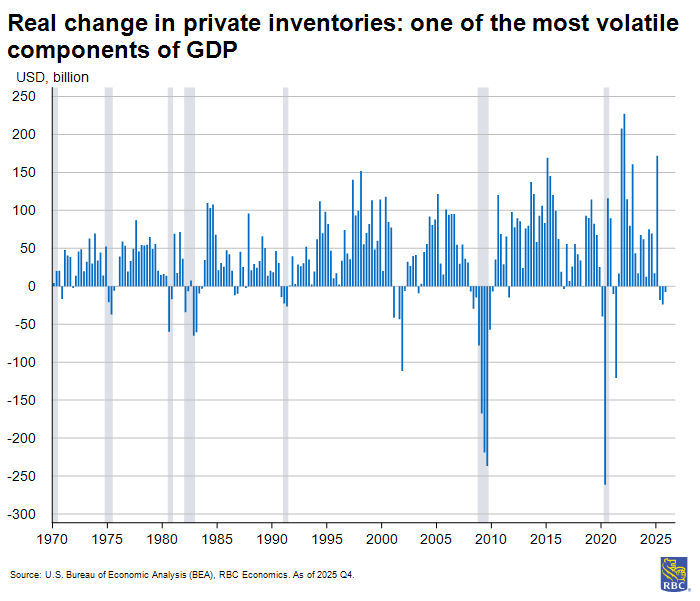
Net changes in inventories are reported in quarterly GDP data, and tend to be “one of the most volatile components of GDP,” according to the Bureau of Economic Analysis (BEA). The change in private inventories (not the level of inventories) adds to or subtracts from GDP each quarter.
“When measuring the level of GDP, the change in, not the level of inventories provides the appropriate measure of the flow of economic activity that is consistent with that measured by the other GDP components,” according to BEA.
If inventories accumulate from the prior quarter, they add to GDP. Conversely, an inventory drawdown subtracts from GDP growth. This is because GDP measures production, not just final sales.
If firms produce goods that aren’t sold, that unsold production still counts as economic output (i.e., production exceeded the sum of the final sales). It is stored instead of consumed and the positive change in inventories adds to GDP for that quarter. On the other hand, when firms sell from existing inventories rather than producing new goods (i.e., final sales exceeded production in the period and the excess sales were filled by drawing down inventories) current-quarter production declines, and the change in inventories subtracts from GDP for that quarter.
What are inventories and what can they tell us about the economy?
Inventories are stocks of goods held by businesses to facilitate the production of goods or services. Typically, firms hold inventories to meet anticipated future demand for products or services.
Inventory movements are typically reflective of expected demand conditions, though there are exceptions to this rule (e.g., supply chain disruptions). In the national accounts, inventories are classified into three categories:
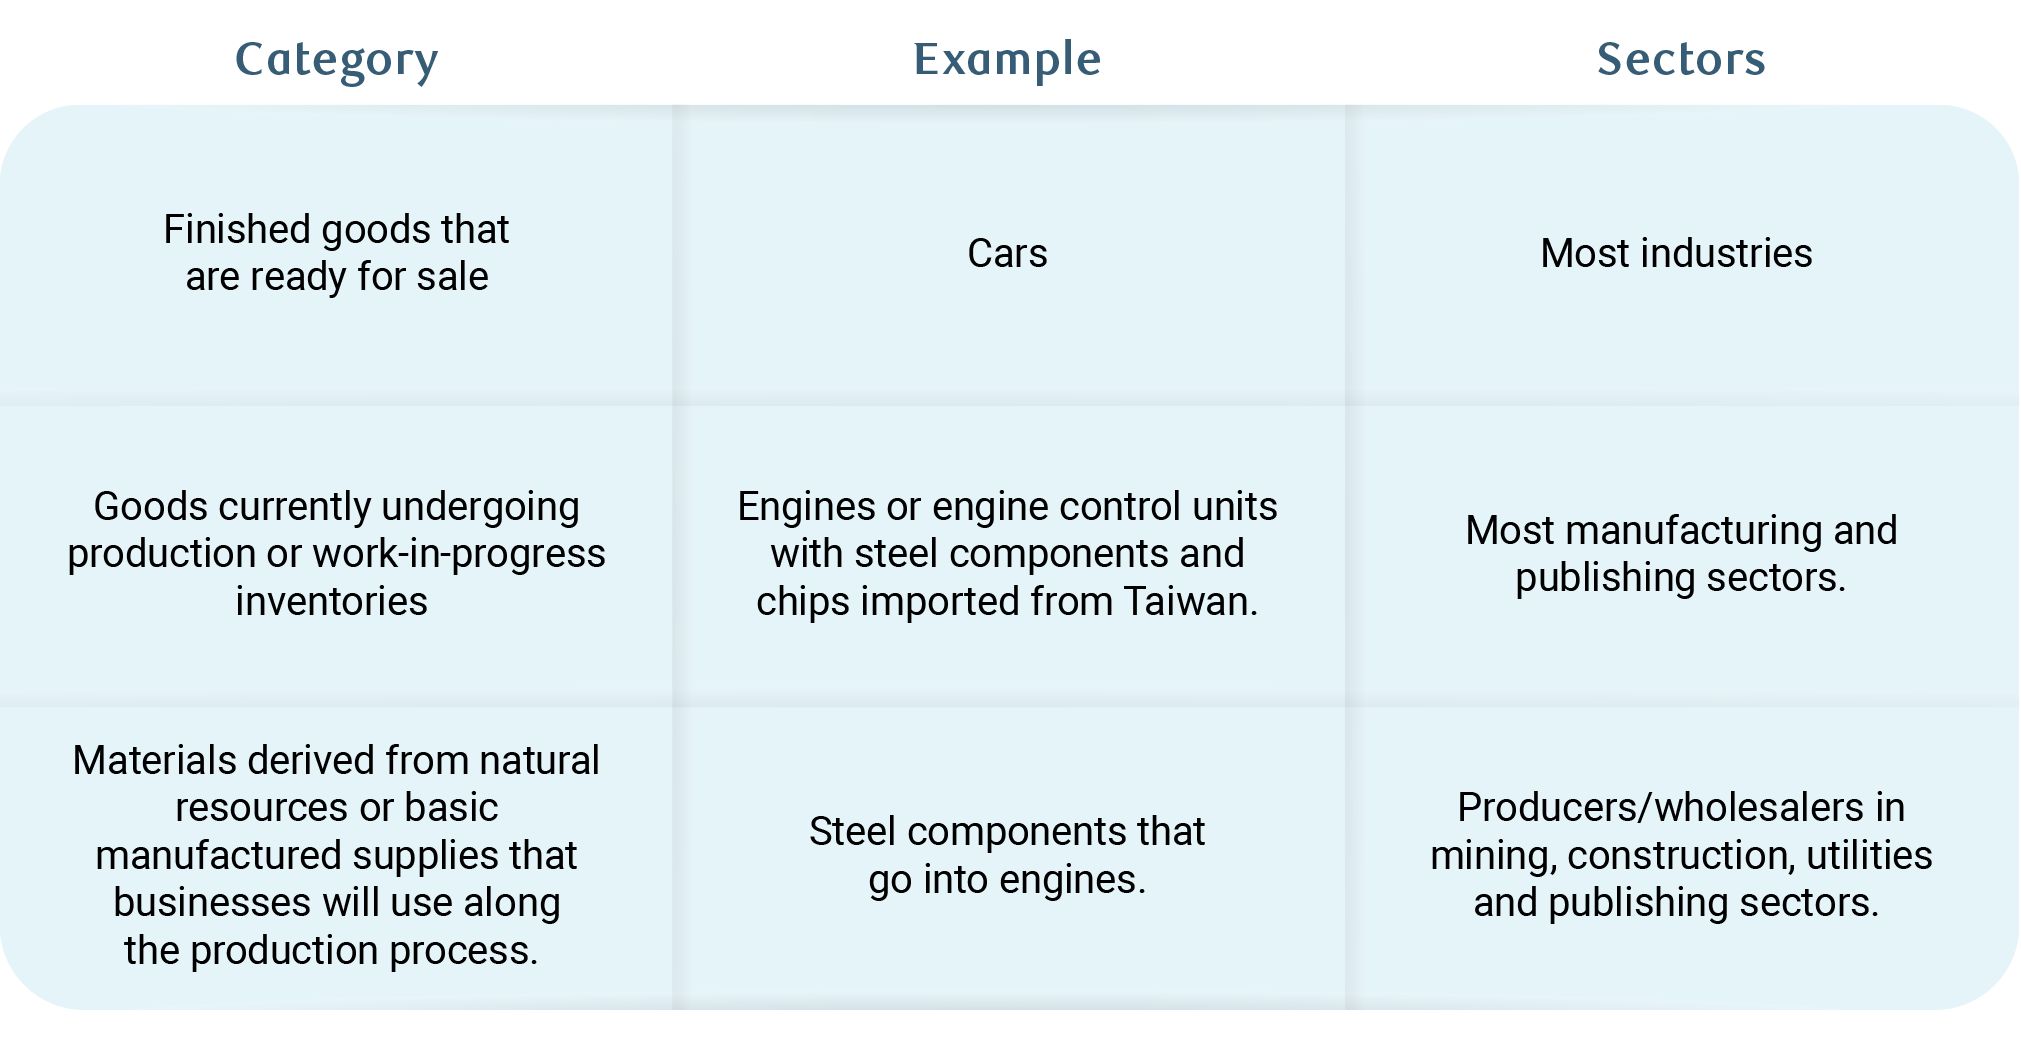
For finished goods, inventory accumulation happens when businesses either import or produce more output than they sell in a given period. This could signal that firms need to scale back production in the face of weaker demand from consumers. It could also signal a build up ahead of a busy season, for example, the holiday shopping season.
For intermediate goods (i.e., goods currently undergoing production) or work-in-process inventories, an inventory accumulation could signal a reduced need for an input in the production process. For example, a car manufacturer facing reduced consumer demand for a specific model of vehicle may scale back production, requiring fewer steel components, tires, and electrical components.
But, to understand the reduction in demand, it is also critical to know how an intermediate input is used across other sectors. Notably, semiconductors are used as an input in many consumer and capital goods, so the change in demand may not necessarily be due to a slowdown in one sector alone.
The inverse is also true. If firms are drawing down inventories more quickly than the production process can supply the market, (i.e., to meet a ramp up in consumer or producer demand), firms may need to increase production (and/or scale up imports) in the near term to meet demand. This was the case in the post-pandemic economy when the new vehicle shortage resulted from a reduction in the supply of semiconductors.
Inventories-to-sales ratios provide useful context to determine where production is likely to trend. If inventories-to-sales ratios are running relatively high, this would suggest demand is slowing, and businesses may move to reduce inventories and slow production.
If inventories-to-sales ratios are low, that would suggest demand is outpacing production and businesses may need to increase production to meet demand. In this vein, the direction of inventory accumulation or depletion can give us important clues about the health of the US economy (or the health of subsectors within the US economy).
It is important to keep in mind that inventory can be costly to hold, so firms typically do not want to store more inventory than they need (of course, there are exceptions to this rule that we discuss below).
Most companies aim for an inventory carrying cost (or total expense associated with storing the materials) around 20% to 30% of total inventory expenses, according to the Institute for Supply Management. Inventory carrying costs comprise not only the cost of the goods but also transportation, warehousing, insurance, and in some cases, costs associated with adverse events like theft, damage, and obsolescence.
There is also an unspoken opportunity cost associated with holding inventories in higher interest rate environments especially, where the cost of storing inventories could have been devoted to other investment opportunities.
The post-pandemic inventory glut
In 2022, we saw a sizeable ramp-up of goods inventories in the aftermath of the pandemic as firms anticipated a major surge in goods demand following the re-opening of the economy.
Businesses stocked up excessively as a backlog of goods impacted by global production and shipping delays arrived at US ports. But consumer demand for goods did not materialize to the extent that firms anticipated. Instead, they rotated back to services spending, prioritizing recreation, dining out, entertainment, and travel.
The result was a massive goods sector inventory surplus. In this scenario, the inventory accumulation both reflected supply shocks (delayed shipments), and changes in demand (consumers rotated to services sector spending at the expense of goods).
The accelerating shift to online sales
Prior to the pandemic, brick and mortar shopping was the primary outlet for consumer shopping in the US. It still is, but to a much lesser extent as electronic shopping (i.e., online shopping) has accounted for a growing share of sales.
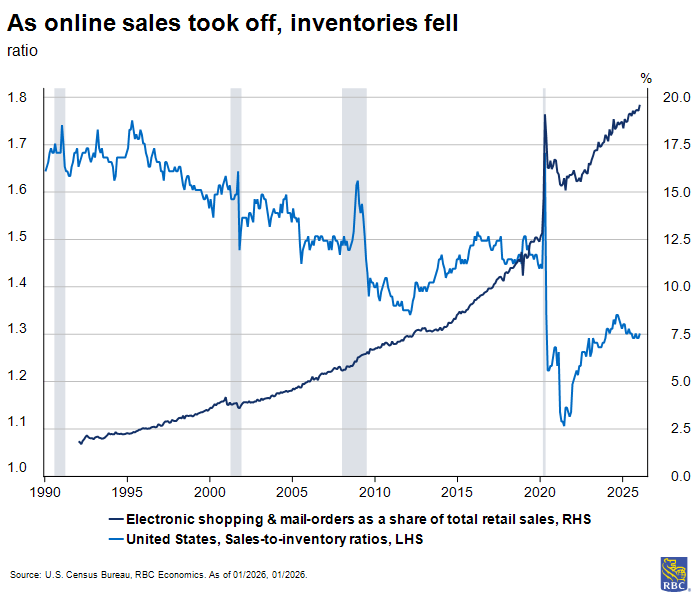
In the early 1990s, electronic shopping and mail order houses accounted for only 2% of total retail sales. By the early 2000s, its share grew to 5% and has been gaining since. By 2019, electronic sales comprised 12% of total retail sales, and from 2019 to 2020, that share jumped to 16% and has continued to accelerate, making up about 20% of total retail sales.
The pandemic accelerated the pivot away from brick-and-mortar shopping as households shifted to online shopping in response to social distancing measures. Once social distancing measures were reversed, many households continue to favor the convenience of online shopping.
As retailers pivoted to online platforms and shipped directly to consumer homes from warehouses, fewer shelves to stock meant leaner inventories. In general, this trend coincides with the normalization of firms holding less inventory relative to monthly sales volumes.
Front-running tariffs in 2025
Ahead of Liberation Day tariffs, firms rushed to build up imports at pre-tariff prices, and stored many as inventories.
We saw a massive spike in inventories in Q1 2025 (to the tune of $172 billion in real terms)—the single largest spike outside of the pandemic recovery period dating back to the 1940s. This was followed by a drawdown in subsequent quarters as pre-tariff inventories were pulled out of warehouses to stock products at pre-tariff prices even after tariffs had been implemented.
We have not seen three subsequent quarters of inventory drawdowns outside of a recession since at least the 1960s. This is an example where higher inventories, as a direct result of a policy announcement, do not necessarily signal slowing demand, but rather a pull-forward of anticipated demand.
In this scenario, businesses rushed to stock up on inventories as a strategy to avoid paying tariffs. After tariffs went into effect, the relatively cheaper inventories could be drawn down and sold at pre-tariff prices, allowing businesses to hold off on passing higher costs off to consumers, likely a tactic to preserve market share.
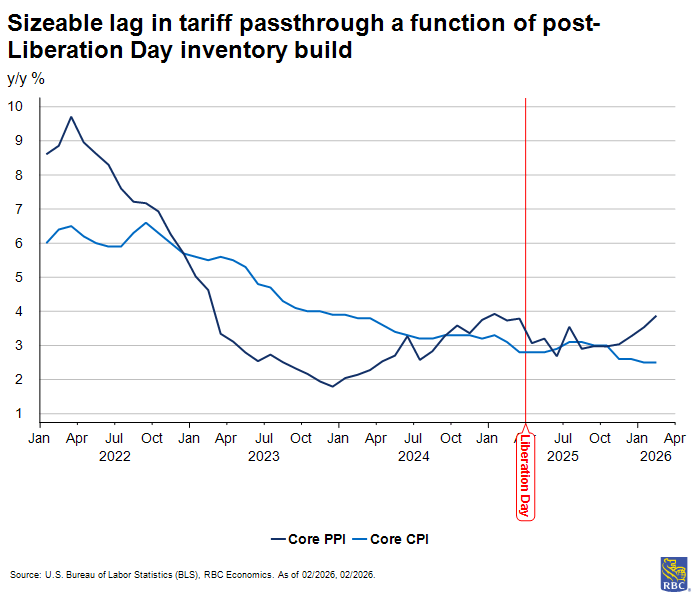
However, once pre-tariff inventories were depleted, firms faced higher costs to restock inventories and have since passed those higher prices along the supply chain. This is why we did not see an immediate spike in consumer prices despite tariffs being in effect.
How are inventories measured and valued?
The BEA measures changes in private inventories (CIPI) as part of the national accounts.
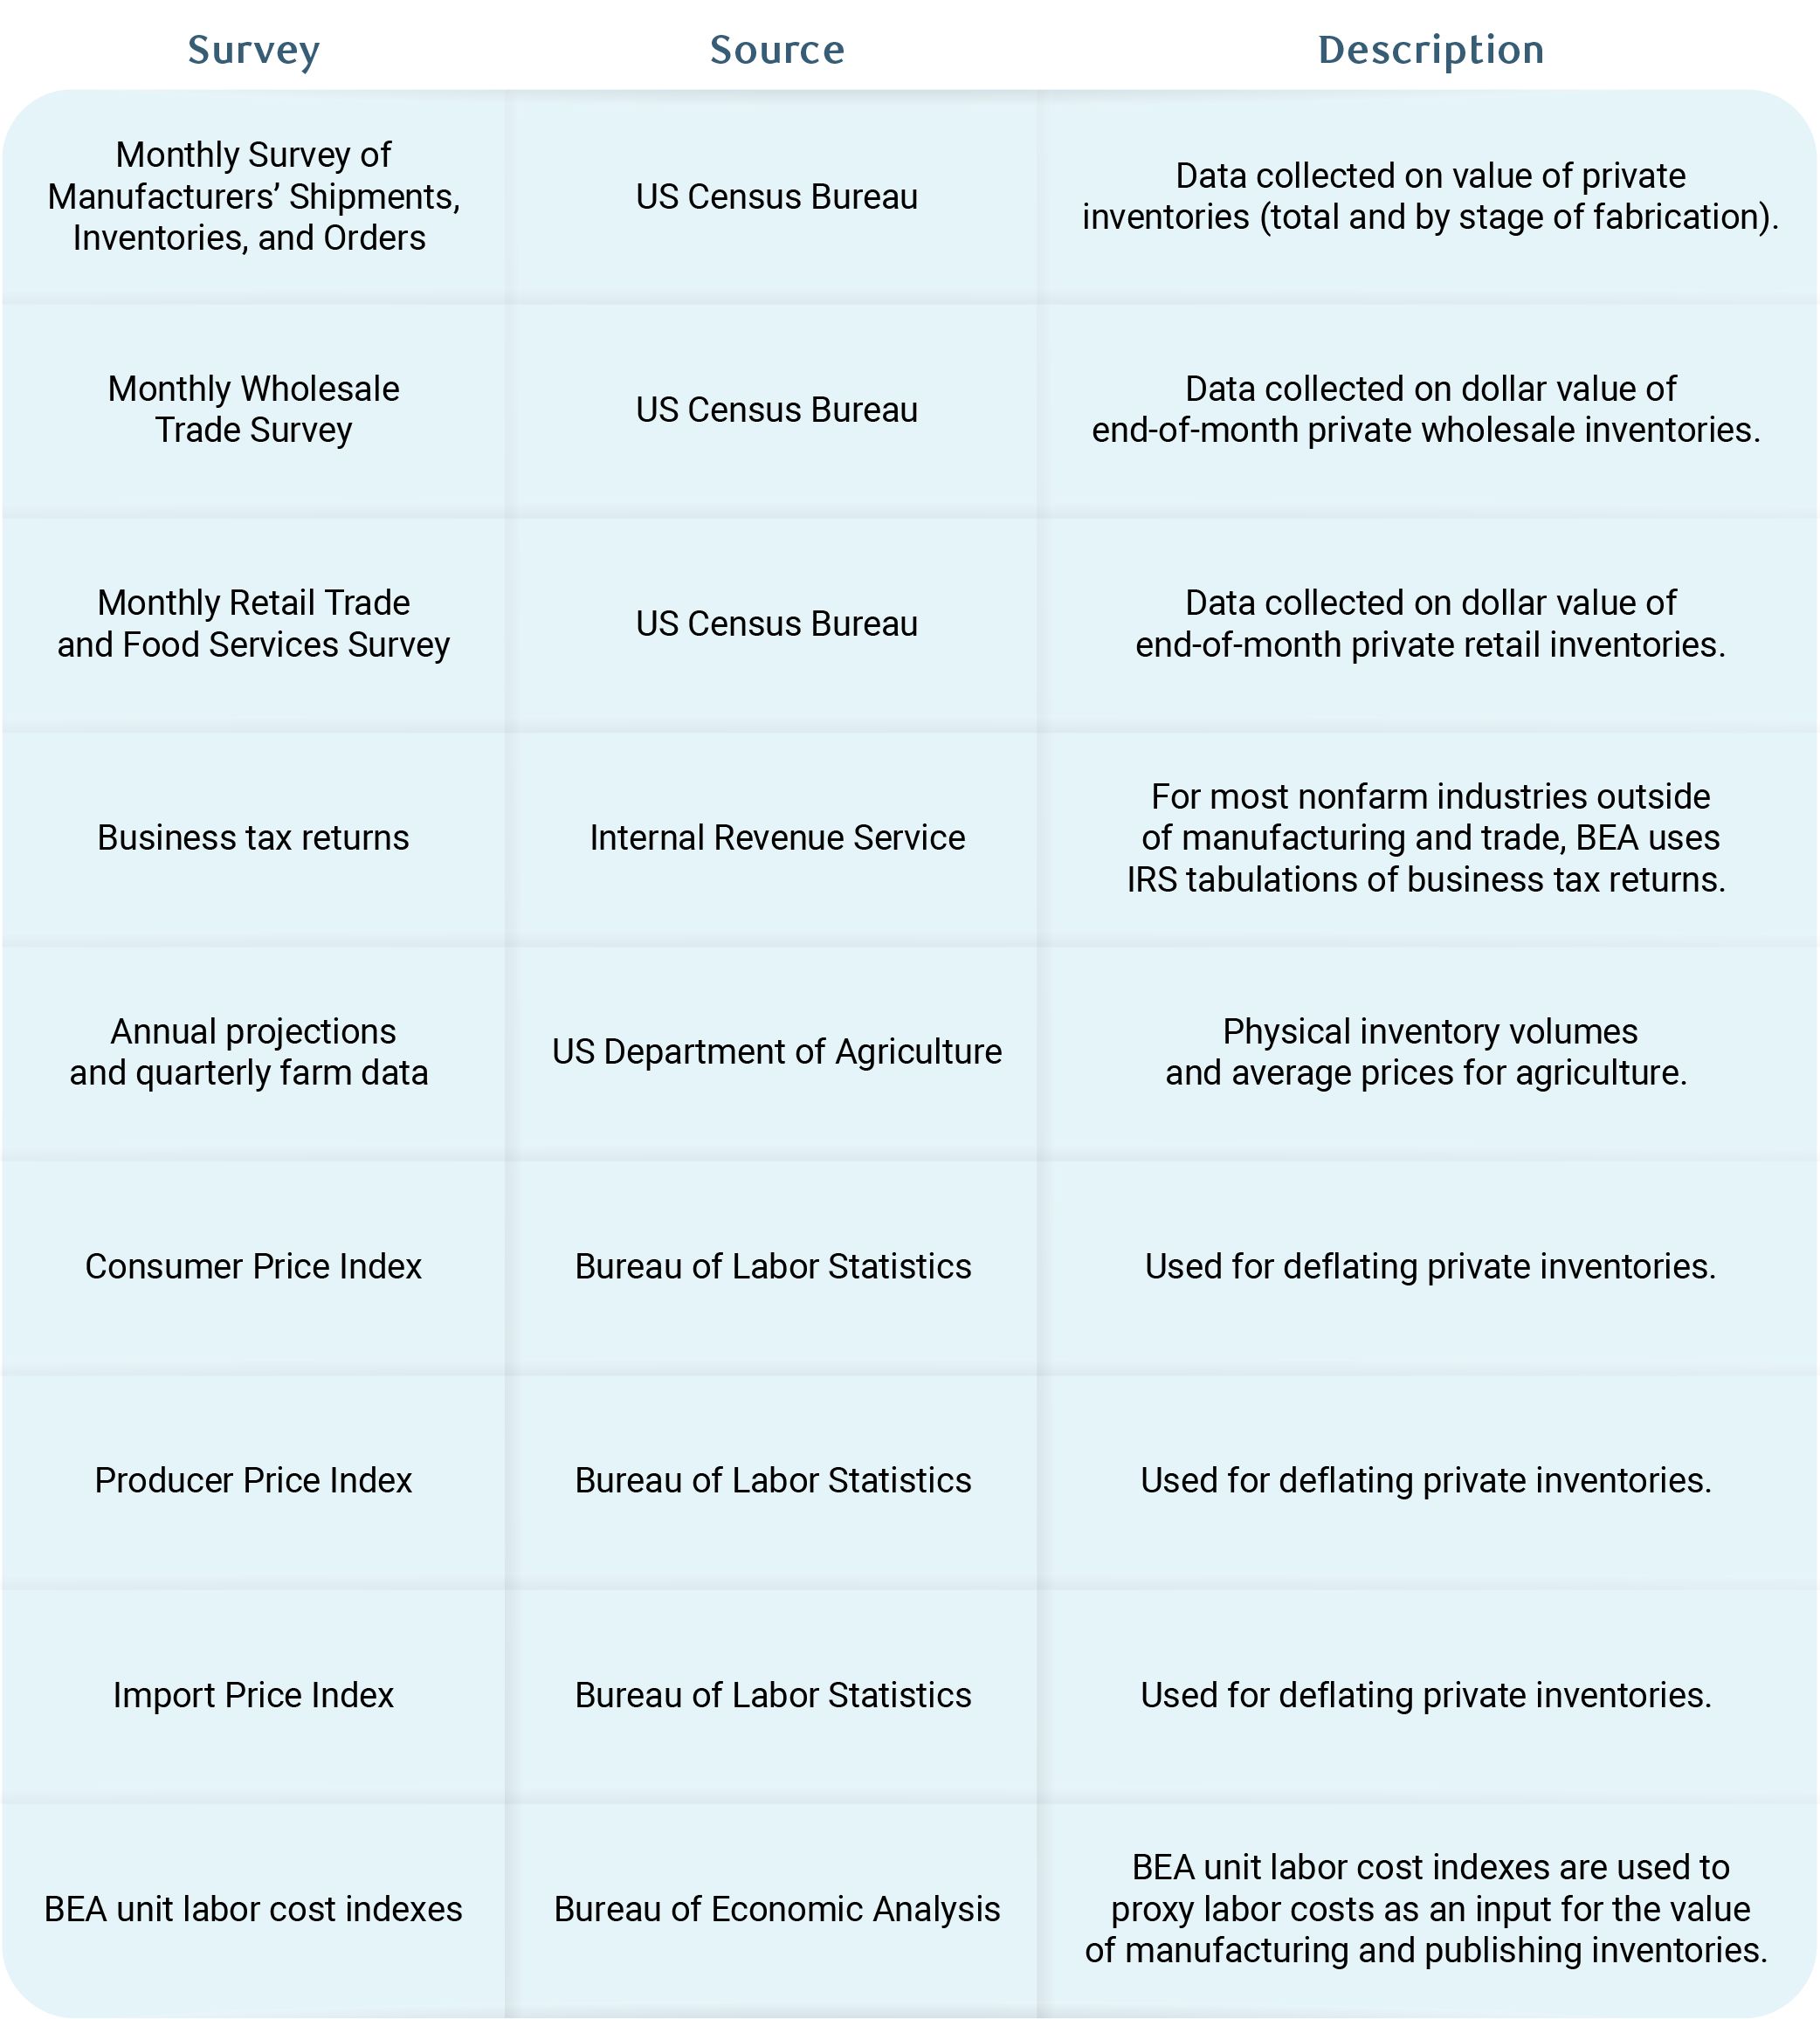
For farms, inventories are the product of physical inventory volumes and average prices from the US Department of Agriculture. For nonfarm sectors, the BEA compiles data on (end-of-period) book values reported by private businesses from US Census surveys (for manufacturing and trade sectors) and IRS tabulations of business tax returns (for most other nonfarm sectors).
One measurement problem is that companies can use different accounting methods to value inventories, which can distort the measure over time. The BEA standardizes these numbers to make them comparable. These adjustments are called inventory valuation adjustments (IVA).
For example, if a company uses last-in first-out (LIFO) accounting during high inflation, LIFO assumes the most recently purchased (and most expensive) inventory gets sold first. This artificially lowers reported inventory values and boosts profit margins on paper. First-in first-out (FIFO) does the opposite—it assumes older, cheaper inventory sells first, which inflates values. The IVA corrects for these distortions, so the BEA’s inventory measure is consistent across companies, regardless of which method they use.
After the BEA standardizes valuations, they calculate both real inventory growth (adjusting for inflation) and nominal growth (unadjusted). Monthly cost indexes are constructed for each industry (and for manufacturing and publishing) using Producer Price Index (PPI) data at each stage of production, and are used to deflate nominal data. Ultimately, the real numbers feed into the headline GDP growth numbers that are reported on a quarterly basis.
How changes in inventories impact GDP growth
When a firm acquires a primary commodity or intermediate input, these products are sold to manufacturers or processors for the next stage of production.
Finished products made by manufacturing firms can be sold to wholesalers or directly to retailers. In both cases, the product that is not sold can be stored in warehouses for purchase later. A manufacturer purchasing a commodity or intermediate input can transport it to a plant for processing or store the product in a warehouse to process at a later period.
Important differences exist in inventory accumulation across sectors
Understanding sectoral patterns matters because inventory management varies significantly by sector.
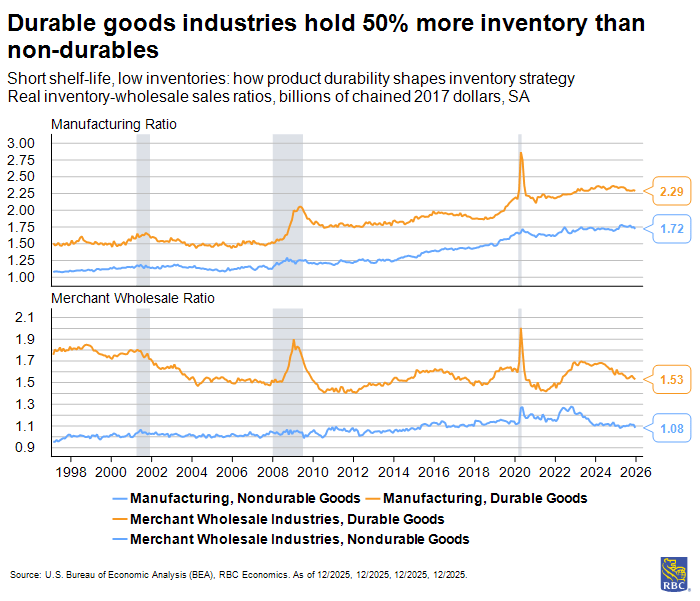
Department stores, clothing and accessory stores, and the automotive sector hold more inventories relative to other sectors—typically twice the volume of monthly sales (though the auto sector has tended to hold fewer inventories post-pandemic). The food and beverage sector, on the other hand, typically holds less than one-month’s worth of products sold in inventories (relative to monthly sales) as nondurable goods with shorter shelf lives.
Since nondurable goods spoil sooner (for example, food products), there is a greater risk that if firms overstock a product in warehouses, that product may spoil and may have to be disposed of before it can be sold. This is a costly mistake that firms try to avoid by being more conservative when accumulating non-durable inventories. This is evident in inventory-to-wholesale sales ratios, where durable goods industries hold 50% more inventory than non-durables.
Patterns of inventory accumulation are evolving
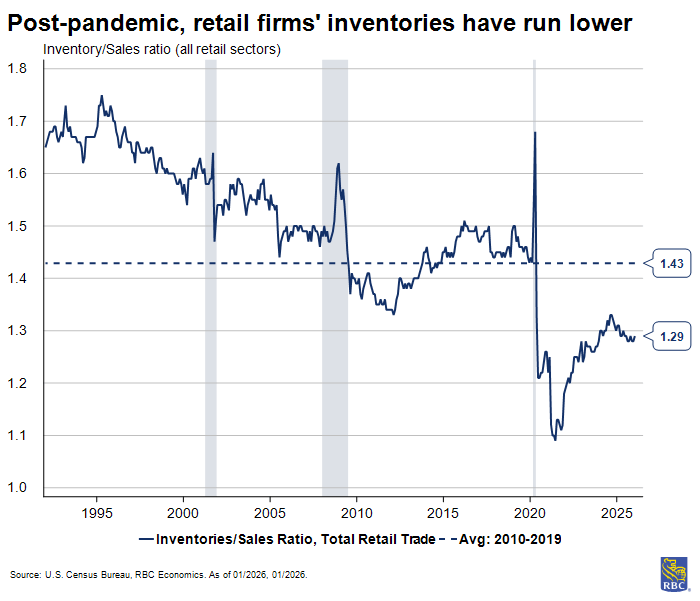
Post-pandemic inventory-to-sales ratios have been running lower relative to pre-pandemic trends.
In the decade between the Global Financial Crisis and the Covid-pandemic, firms across all retail sectors typically held 1.4 months’ worth of product sold in inventories. In the aftermath of the pandemic (from 2021 to 2024), that number fell to 1.2. The motor vehicle sector was largely responsible, holding drastically fewer inventories relative to pre-pandemic.
We have seen this trend partially reverse since tariffs were announced. The auto sector is currently approaching 2 months’ worth of product sales (for context, this sector averaged 1.5 months’ worth of product sales in inventories from 2021 through 2024). Interestingly, both the building materials sector and department stores have accumulated more inventories in 2025 compared to pre-pandemic era (on average).
The outlook for inventories
Following the post-Liberation Day inventory buildup, we have witnessed three consecutive quarters of inventory drawdowns—something that typically only occurs during recessions.
Looking at inventory-to-sales ratios, inventory levels remain well-above post-pandemic lows (1.1 in 2021), but still below the pre-pandemic average of 1.4.
In the coming quarters, we expect some firms will continue to draw down pre-tariff inventories, pushing the ratio lower. But as firms restock inventories at post-tariff prices, levels will likely begin to normalize since firms will see little benefit in facing storage costs for excess products.
As inventories are depleted, we expect to see a more sizable impact from tariffs on inflation. But the timing is not especially clear. Since some firms have been utilizing bonded warehouses to store inventories, there is no way to know how many months’ worth of excess inventories are currently in storage based on BEA data alone.
Since goods in bonded warehouses do not yet count as goods available for domestic consumption, they are not captured in the data. It is likely that current inventory levels are higher than the BEA data suggests.
It may well be the case that the inventory drawdown continues throughout 2026. But once inventories are restocked at post-tariff prices, firms facing higher costs will likely pass along higher prices to wholesalers and consumers to protect margins (i.e., corporate profits).
We have already seen spikes in PPIs for three consecutive months, which suggests tariff passthrough is underway, at least for some product groups. Still, corporate profits have fallen significantly in some trade exposed sectors including wholesale trade and transportation and warehousing. It signals there is some margin compression happening, and the response from businesses has been to pass on higher prices.
We have already seen job losses in trade-exposed sectors like transportation and warehousing. The wholesale sector will be at risk of shedding more jobs unless those higher prices are passed on.
The timing and severity of the inflation impact remains uncertain, but we expect to see the impact on consumer prices peak by mid-year.
About the Authors :
Mike Reid is Head of US Economics at RBC. He is responsible for generating RBC’s US economic outlook, providing commentary on macro indicators, and producing written analysis around the economic backdrop.
Carrie Freestone is a Senior US Economist at RBC. Carrie is responsible for projecting key US indicators including GDP, employment, consumer spending and inflation for the US. She also contributes to commentary surrounding the US economic backdrop which she delivers to clients through publications, presentations, and the media.
Imri Haggin is an US Economist at RBC, where he focuses on thematic research. His prior work has centered on consumer credit dynamics and treasury modeling, with an emphasis on leveraging data to understand behavior.
This article is intended as general information only and is not to be relied upon as constituting legal, financial or other professional advice. The reader is solely liable for any use of the information contained in this document and Royal Bank of Canada (“RBC”) nor any of its affiliates nor any of their respective directors, officers, employees or agents shall be held responsible for any direct or indirect damages arising from the use of this document by the reader. A professional advisor should be consulted regarding your specific situation. Information presented is believed to be factual and up-to-date but we do not guarantee its accuracy and it should not be regarded as a complete analysis of the subjects discussed. All expressions of opinion reflect the judgment of the authors as of the date of publication and are subject to change. No endorsement of any third parties or their advice, opinions, information, products or services is expressly given or implied by Royal Bank of Canada or any of its affiliates.
This document may contain forward-looking statements within the meaning of certain securities laws, which are subject to RBC’s caution regarding forward-looking statements. ESG (including climate) metrics, data and other information contained on this website are or may be based on assumptions, estimates and judgements. For cautionary statements relating to the information on this website, refer to the “Caution regarding forward-looking statements” and the “Important notice regarding this document” sections in our latest climate report or sustainability report, available at: https://www.rbc.com/community-social-impact/reporting-performance/index.html. Except as required by law, none of RBC nor any of its affiliates undertake to update any information in this document.
Get the latest forecasts and analysis from RBC Economics.
Subscribe Now
- Inventories as measured by BEA in the national accounts
- What are inventories and what can they tell us about the economy?
- The post-pandemic inventory glut
- The accelerating shift to online sales
- Front-running tariffs in 2025
- How are inventories measured and valued?
- How changes in inventories impact GDP growth
- Important differences exist in inventory accumulation across sectors
- Patterns of inventory accumulation are evolving
- The outlook for inventories