

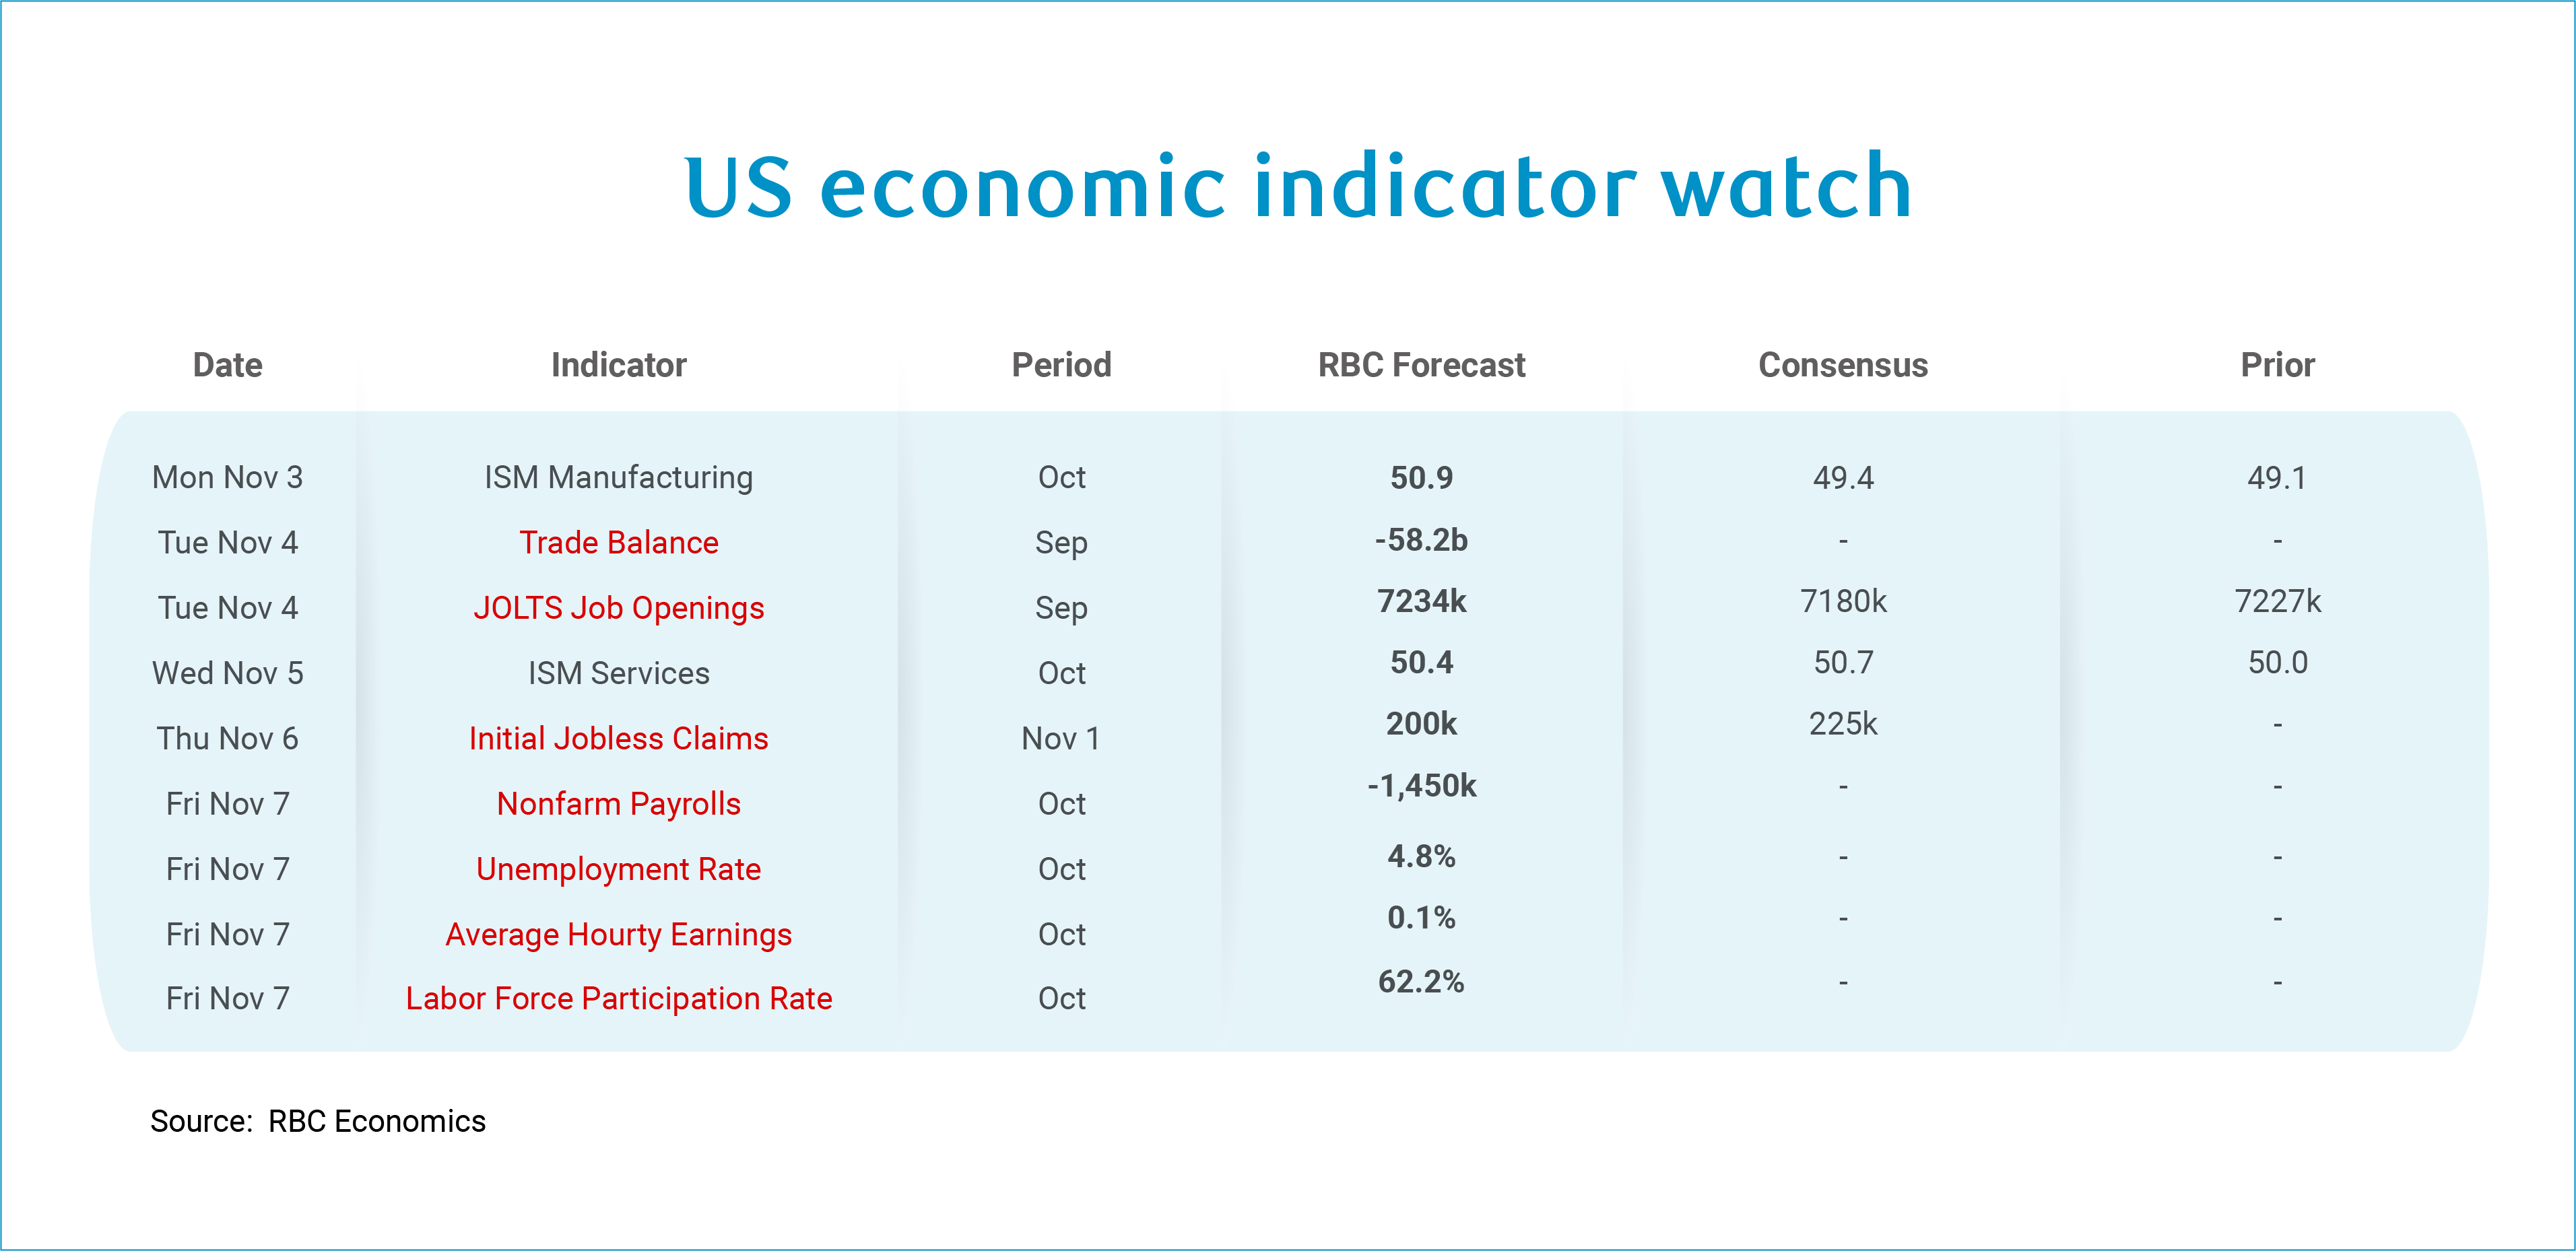
As the US government shutdown enters its fifth week, we continue to provide forecasts. The data in the table below that is highlighted in red will not be released if the shutdown continues. While we will not be receiving government data next week, we will get both ISM Manufacturing and ISM Services data.
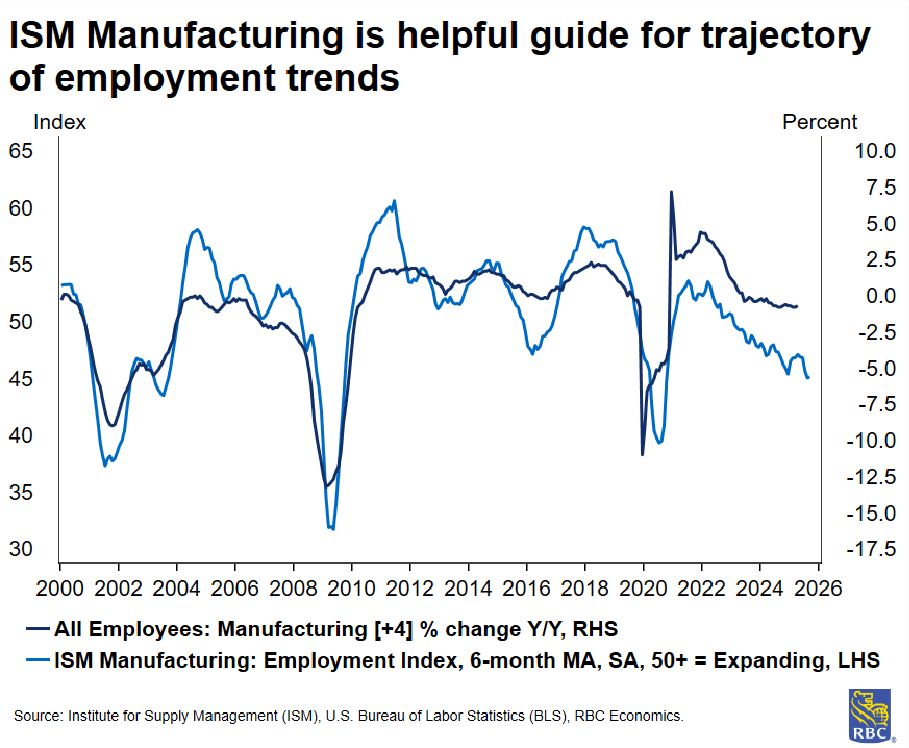
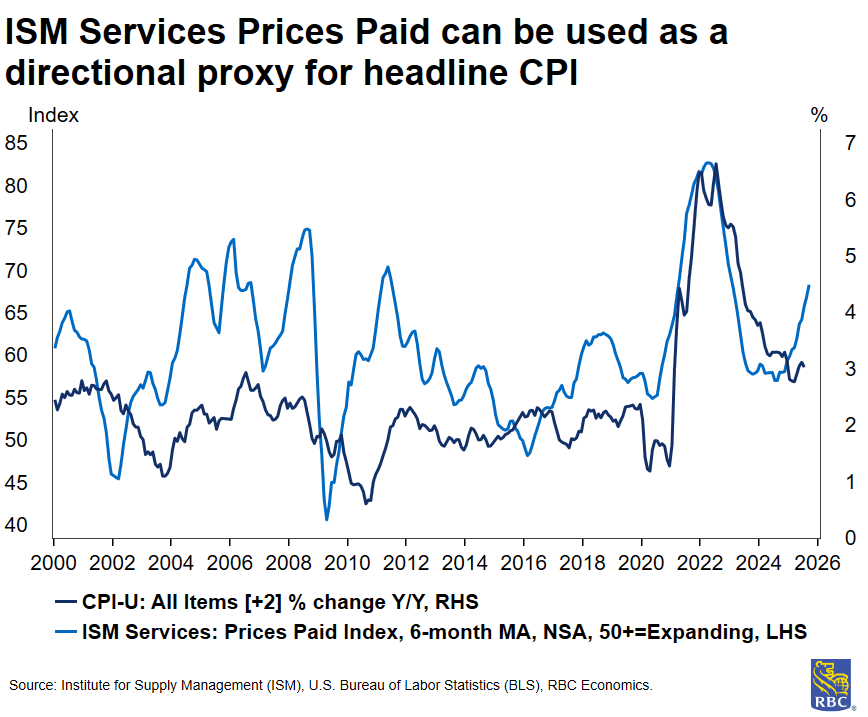
In both the reports, we will be closely watching the Prices Paid and Employment indices for signals of October price and labor market trends in the absence of government data. We also get Wards Auto data, which will be useful for gauging consumer demand as well as shifts in purchasing patterns as it relates to tariffs. With the pull forward we saw earlier in the year, we expect auto sales will slow in the months ahead.
The ISM Manufacturing report is expected to point to an improvement in activity in October. If we do get a >50 print, this will be the first expansionary print since February 2025. Four of five regional Fed surveys that track manufacturing activity pointed to an improvement in October. We look for the ISM Services survey to show continued expansion in October at 50.4. Two of the four Fed regional surveys have pointed to an improved outlook in October. Still, the government shutdown is more likely to weigh on the services sector and there is a risk we could see the ISM services dip into contraction territory – while it does not include the government sector, contractors would be captured.
The reality is that the October NFP print will be significantly distorted by the government shutdown. We expect to see -1.4M jobs shed in October. However, more importantly, in the absence of a government shutdown, we would have estimated about +30K jobs would have been added in the private sector. This is just roughly in-line with what we estimate to be the current break-even rate of employment (which is 40K). State-level jobless claims data, private job posting data, and private payroll estimates from ADP all suggest the labor market stabilized between September and October. While the shutdown still brings downside risks to the labor market in the near term, for now, we view the structural demographic factors as driving the force in the labor market heading into 2026.
In the US, there are just over 2.3M federal employees excluding self-funded US Postal Service workers. We estimate that of those 2.3M, approximately 750K federal employees are currently furloughed and an additional 730K are working without pay. The remaining federal employees are working with pay, as agency funding comes from special laws or external funds, according to the Bipartisan Policy Center. Since the nonfarm payroll report is compiled based on payroll data, and since over half of US federal workers were not paid during the pay cycle including the reference week (the week containing the 12th of the month), we expect to see that those 1.48M unpaid federal employees will not be counted as employed in the NFP report. There are also likely to be some spillovers to private-sector government contract workers, as some contractors (i.e. private sector consultants) may also be furloughed or laid off.
As we wrote in a previous note, while 730K essential federal workers (who are working without pay) will still be counted as employed, but the 750K furloughed federal employees will be classified as “on temporary layoff” and will count as unemployed in the household survey. This means that we are likely to see a sizeable rise in the unemployment rate to 4.8% (by our calculations ). This will likely be a one-month blip in the UER (so long as the shutdown does extend beyond November 15th) but could prove problematic for the Federal Reserve in the December meeting as these distortions will make it exceedingly difficult to get a clean read on the state of the US labor market.
About the Authors
Mike Reid is a Senior U.S. Economist at RBC. He is responsible for generating RBC’s U.S. economic outlook, providing commentary on macro indicators, and producing written analysis around the economic backdrop.
Carrie Freestone is an economist and a member of the macroeconomic analysis group. She is responsible for examining key economic trends including consumer spending, labour markets, GDP, and inflation.
Imri Haggin is an economist at RBC Capital Markets, where he focuses on thematic research. His prior work has centered on consumer credit dynamics and treasury modeling, with an emphasis on leveraging data to understand behavior.
This article is intended as general information only and is not to be relied upon as constituting legal, financial or other professional advice. The reader is solely liable for any use of the information contained in this document and Royal Bank of Canada (“RBC”) nor any of its affiliates nor any of their respective directors, officers, employees or agents shall be held responsible for any direct or indirect damages arising from the use of this document by the reader. A professional advisor should be consulted regarding your specific situation. Information presented is believed to be factual and up-to-date but we do not guarantee its accuracy and it should not be regarded as a complete analysis of the subjects discussed. All expressions of opinion reflect the judgment of the authors as of the date of publication and are subject to change. No endorsement of any third parties or their advice, opinions, information, products or services is expressly given or implied by Royal Bank of Canada or any of its affiliates.
This document may contain forward-looking statements within the meaning of certain securities laws, which are subject to RBC’s caution regarding forward-looking statements. ESG (including climate) metrics, data and other information contained on this website are or may be based on assumptions, estimates and judgements. For cautionary statements relating to the information on this website, refer to the “Caution regarding forward-looking statements” and the “Important notice regarding this document” sections in our latest climate report or sustainability report, available at: https://www.rbc.com/our-impact/sustainability-reporting/index.html. Except as required by law, none of RBC nor any of its affiliates undertake to update any information in this document.