|
 |
 |
 |
 |
 |
 |
 |
 |
 |
 |
 |
 |
 |
 |
 |
 |
 |
 |
 |
| |
FINANCIAL HIGHLIGHTS (1) |
|
|
|
|
|
|
|
|
|
 |
|
|
 |
 |
|
|
(C$ millions, except per
share,
number and percentage amounts) |
Change
2003/2002 |
|
|
2003 |
|
|
2002 |
|
|
2001 |
|
|
2000 |
|
|
1999 |
|
|
 |
 |
|
|
|
|
|
|
|
|
|
|
|
|
|
|
|
|
|
|
|
|
|
EARNINGS |
|
|
|
|
|
|
|
|
|
|
|
|
|
|
|
|
|
|
|
Net interest income |
(4 |
) % |
$ |
6,648 |
|
$ |
6,928 |
|
$ |
6,291 |
|
$ |
5,195 |
|
$ |
5,070 |
|
|
|
Non-interest income |
2 |
|
|
10,299 |
|
|
10,132 |
|
|
9,514 |
|
|
7,536 |
|
|
6,070 |
|
|
|
Total revenues |
(1 |
) |
|
16,947 |
|
|
17,060 |
|
|
15,805 |
|
|
12,731 |
|
|
11,140 |
|
|
|
Provision for credit losses |
(33 |
) |
|
715 |
|
|
1,065 |
|
|
1,119 |
|
|
691 |
|
|
760 |
|
|
|
Insurance policyholder
benefits,
claims and acquisition expense |
6 |
|
|
1,404 |
|
|
1,330 |
|
|
1,153 |
|
|
772 |
|
|
532 |
|
|
|
Non-interest expense |
– |
|
|
10,236 |
|
|
10,244 |
|
|
9,641 |
|
|
7,628 |
|
|
7,141 |
|
|
|
Net income |
5 |
|
|
3,036 |
|
|
2,898 |
|
|
2,435 |
|
|
2,208 |
|
|
1,725 |
|
|
|
Return on common equity (ROE) (2) |
40 |
bp |
|
17.0% |
|
|
16.6% |
|
|
16.6% |
|
|
19.3% |
|
|
15.3% |
|
|
 |
 |
|
| |
|
|
|
|
|
|
|
|
|
|
|
|
|
|
|
|
|
|
|
BALANCE SHEET DATA |
|
|
|
|
|
|
|
|
|
|
|
|
|
|
|
|
|
|
|
Loans (before allowance for loan losses) |
1 |
% |
$ |
172,547 |
|
$ |
171,523 |
|
$ |
171,177 |
|
$ |
156,184 |
|
$ |
144,793 |
|
|
|
Assets |
8 |
|
|
412,591 |
|
|
382,000 |
|
|
362,562 |
|
|
294,173 |
|
|
273,406 |
|
|
|
Deposits |
6 |
|
|
260,518 |
|
|
245,040 |
|
|
235,687 |
|
|
206,237 |
|
|
187,897 |
|
|
|
Subordinated debentures |
(5 |
) |
|
6,581 |
|
|
6,960 |
|
|
6,861 |
|
|
5,825 |
|
|
4,596 |
|
|
|
Common equity |
– |
|
|
17,304 |
|
|
17,240 |
|
|
16,215 |
|
|
11,296 |
|
|
10,435 |
|
|
 |
 |
|
| |
|
|
|
|
|
|
|
|
|
|
|
|
|
|
|
|
|
|
|
CAPITAL RATIOS
(CANADIAN BASIS) (3) |
|
|
|
|
|
|
|
|
|
|
|
|
|
|
|
|
|
|
|
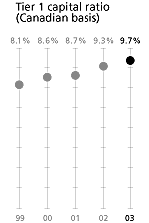
Tier 1 capital |
40 |
bp |
|
9.7% |
|
|
9.3% |
|
|
8.7% |
|
|
8.6% |
|
|
8.1% |
|
|
|
Total capital |
10 |
|
|
12.8 |
|
|
12.7 |
|
|
11.8 |
|
|
12.0 |
|
|
11.2 |
|
|
|
Common equity to risk-adjusted
assets |
10 |
|
|
10.5 |
|
|
10.4 |
|
|
9.4 |
|
|
7.3 |
|
|
7.1 |
|
|
CAPITAL RATIOS (U.S. BASIS) (4) |
|
|
|
|
|
|
|
|
|
|
|
|
|
|
|
|
|
|
|
Tier 1 capital |
20 |
|
|
8.7 |
|
|
8.5 |
|
|
8.1 |
|
|
7.8 |
|
|
7.6 |
|
|
|
Total capital |
10 |
|
|
12.0 |
|
|
11.9 |
|
|
11.2 |
|
|
11.3 |
|
|
10.7 |
|
|
|
Common equity to risk-adjusted
assets |
(20 |
) |
|
10.3 |
|
|
10.5 |
|
|
9.5 |
|
|
7.2 |
|
|
7.0 |
|
|
 |
 |
|
| |
|
|
|
|
|
|
|
|
|
|
|
|
|
|
|
|
|
|
|
COMMON SHARE INFORMATION |
|
|
|
|
|
|
|
|
|
|
|
|
|
|
|
|
|
|
|
Shares outstanding (in thousands) |
|
|
|
|
|
|
|
|
|
|
|
|
|
|
|
|
|
|
|
|
End of year |
(1 |
) % |
|
656,021 |
|
|
665,257 |
|
|
674,021 |
|
|
602,398 |
|
|
617,768 |
|
|
|
|
Average basic |
(2 |
) |
|
662,080 |
|
|
672,571 |
|
|
641,516 |
|
|
606,389 |
|
|
626,158 |
|
|
|
|
Average diluted |
(1 |
) |
|
669,625 |
|
|
679,153 |
|
|
647,216 |
|
|
609,865 |
|
|
632,305 |
|
|
|
Earnings per share |
|
|
|
|
|
|
|
|
|
|
|
|
|
|
|
|
|
|
|
|
Basic |
8 |
|
$ |
4.48 |
|
$ |
4.16 |
|
$ |
3.58 |
|
$ |
3.42 |
|
$ |
2.50 |
|
|
|
|
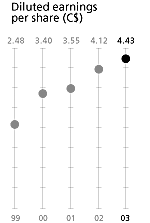
Diluted |
8 |
|
|
4.43 |
|
|
4.12 |
|
|
3.55 |
|
|
3.40 |
|
|
2.48 |
|
|
|
Share price |
|
|
|
|
|
|
|
|
|
|
|
|
|
|
|
|
|
|
|
|
High (5) |
10 |
|
|
65.00 |
|
|
58.89 |
|
|
53.25 |
|
|
48.88 |
|
|
42.13 |
|
|
|
|
Low (5) |
18 |
|
|
53.26 |
|
|
45.05 |
|
|
41.60 |
|
|
27.25 |
|
|
29.65 |
|
|
|
|
Close |
17 |
|
|
63.48 |
|
|
54.41 |
|
|
46.80 |
|
|
48.30 |
|
|
31.73 |
|
|
|
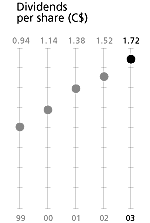
Dividends per share |
13 |
|
|
1.72 |
|
|
1.52 |
|
|
1.38 |
|
|
1.14 |
|
|
0.94 |
|
|
|
Book value per share –
year-end |
2 |
|
|
26.38 |
|
|
25.91 |
|
|
24.06 |
|
|
18.75 |
|
|
16.89 |
|
|
|
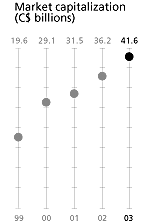
Market capitalization
(C$ billions) |
15 |
|
|
41.6 |
|
|
36.2 |
|
|
31.5 |
|
|
29.1 |
|
|
19.6 |
|
|
 |
 |
|
|
|
|
|
|
|
|
|
|
|
|
|
|
|
|
|
|
|
|
|
NUMBER OF: |
|
|
|
|
|
|
|
|
|
|
|
|
|
|
|
|
|
|
|
Employees (full-time equivalent) |
1,263 |
|
|
60,812 |
|
|
59,549 |
|
|
57,568 |
|
|
49,232 |
|
|
51,891 |
|
|
|
Automated banking machines |
(85 |
) |
|
4,401 |
|
|
4,486 |
|
|
4,545 |
|
|
4,517 |
|
|
4,585 |
|
|
|
Service delivery units |
|
|
|
|
|
|
|
|
|
|
|
|
|
|
|
|
|
|
|
|
Canada |
(14 |
) |
|
1,297 |
|
|
1,311 |
|
|
1,317 |
|
|
1,333 |
|
|
1,410 |
|
|
|
|
International |
(19 |
) |
|
788 |
|
|
807 |
|
|
724 |
|
|
306 |
|
|
99 |
|
|
 |
 |
|
|
|
|
|
|
|
(1) |
|
Financial information is derived from
U.S. GAAP consolidated financial statements, unless otherwise noted.
Select definitions are available in the Glossary on pages 109 and
110. |
|
|
(2) |
|
Return on equity is defined in the
Glossary on page 110. |
|
|
(3) |
|
Using guidelines issued by the Superintendent
of Financial Institutions Canada and Canadian GAAP financial information. |
|
|
(4) |
|
Using guidelines issued
by the Board of Governors of the Federal Reserve System in the U.S.
and U.S. GAAP
financial information. |
|
|
(5) |
|
Intraday high and low share prices. |
|
|


